Brainstorming

I’ve touched on the idea of brainstorming previously, but today I wanted to address it specifically. The simplest way to describe brainstorming is that it is the act of generating as many options as possible, relevant to a particular situation, in a reasonably short amount of time. While brainstorming may primarily be associated with possible feature or solutions, it can actually be applied to any aspect of any problem in any phase of its evolution. it is certainly applicable to all the possible phases of a problem in the framework I have defined.

That is, you can use this technique to help plan a project, define the problem, simplify the problem, source data and methods for collecting it, define requirements, propose solutions, figure out modes of implementation and testing, and determine how to deliver and deploy.

Brainstorming can be greatly aided by getting many different people involved that have may different types of experience and points of view. That is one specific way of looking at a situation from as many viewpoints as possible, but there are other ways.

Many formalized techniques are actually methodologies that guide you through a process of brainstorming by explicitly describing perspectives you should look from. UML is a classic example of this, but the approaches in every management and analytical approach does something similar. As I point out endlessly, every approach has its shortcomings and no approach will always work if applied by rote. At some point you must actually understand a problem in your gut and apply the art of analysis and insight along with the science.

One other form of forcing yourself to look at a problem from many perspective is to identify every combination and permutation of options you can identify. For example, if you have five different parameters each of which have four different possible options you end up with 4^5 or 1024 different combinations to explore.

Another way to ensure you consider a wide variety of options is to think of a problem as and equation, and then consider what happens when you modify every variable in that equation up or down, and the reasons why each variable may be modified.

A lot of poor analyses come from not considering some variables and some directions of change. This is often done on purpose (especially for discussions of political subjects) if some participants want to steer the conversation in directions that benefit them. Henry Hazlitt’s classic book Economics In One Lesson talks over and over again about how all of the downstream effects of an action must be considered, not just the obvious ones someone might want you to see. This type of analysis will force participants to consider more of the causes and effects, inputs and outputs, and opportunity costs for various courses of action. Another classic work in the economics literature is Frédéric Bastiat’s 1850 essay That Which is Seen, and That Which is Not Seen.

I wrote at least one additional article about being thorough here. This isn’t strictly about brainstorming per se, but it does involve considering more options than you might have originally planned to, and that is a close cousin to the topic.

If you have any thoughts you’d like to add on this subject I’d love to hear them.

Posted in Tools and methods | Tagged , , , | Leave a comment

Process Analysis and Process Modeling

The vast majority of my career has involved process analysis and process modeling, usually but not always associated with computer simulation for various applications. I’ve always thought of the two activities as being essentially the same, but the BABOK distinguishes the two terms by defining modeling as the creation and maintenance of models, which are representations of the processes of interest, and defining analysis as what you do to design or improve a process. I think of them as being completely intertwined because you cannot do process analysis without having a process model, and there’s not much point in having a model if you aren’t going to use it to perform analysis.

Note that the BABOK spells “modelling” with two Ls per rules in used all English-speaking countries except the United States. The IIBA, of course, is based in Canada. We Americans are a bit iconoclastic on this point.

While modeling and analysis are largely intertwined, I can think of a few legitimate reasons for maintaining models without doing subsequent analysis.

  • Documentation
  • Communication (for common understanding and situational awareness)
  • Configuration Management

Models come in many forms. I typically think about them as having the following components:

Within my analytical framework, process modeling is the process of creating or updating the conceptual model of the process under consideration. This is the second of the six major phases of a project or engagement. You perform discovery to find out what materials and operations make up the process, and then you perform data collection to characterize each aspect of the process, both qualitatively and quantitatively.

Analysis is typically done during the requirements and design phases of an engagement. These are phases three and four in my framework. The number of techniques that can be used to perform analysis are practically infinite. Simulation is a tool I use quite often. Six Sigma is about reducing variation to (in theory) reduce waste and improve quality. Lean is about rearranging or substituting steps to accomplish more work with the same resources or the same work with less resource &emdash; or ideally both.

I don’t know how much of the material from the BABOK I’m allowed to reproduce here, so I will instead refer readers to section 10.34 for its description of Process Analysis and section 10.35 for its description of Process Modeling. These are within chapter Ten’s list of fifty business analysis techniques.

Posted in Tools and methods | Tagged , , , , | Leave a comment

BABOK Chapter Four: An Approach vs. A Step

While helping a certification study group run by my local IIBA chapter, we inevitably reached chapter four in the BABOK. Chapters three through eight describe the six main knowledge areas for business analysis. They are related to each other per a diagram in the version 3 BABOK (Figure 1.4.1), but that relationship isn’t linear or sequential.

When I discuss my framework for doing business analysis, I approach it from a more linear and sequential viewpoint, as shown here.

I’m always careful to say that my own framework is more a way of thinking about how to do things than a hard-and-fast prescription, as shown in the following figures.

Per the grid below, I observe that business analysis engagements can take many different forms, so the BABOK presents things in a diffuse way, more in terms of techniques and approaches than in terms of “do A, B, and C precisely in order.”

The left column shows the six major phases in my framework, along with the extra phases in a fully realized engagement. The top row shows the six knowledge areas in order as they are presented in the BABOK. I entered bold Xs in the grid where I thought there was an especially direct analog between how I think about things and how the BABOK presents them, and a muted smaller one where I thought there was a relationship but less direct. While I think of the BABOK’s approach and mine as being somewhat orthogonal, the BABOK describes approaches while I describe steps, you may note that the bold marks flow roughly from upper left to lower right, suggesting that both approaches tend to represent a flow through an engagement.

Addressing BABOK chapter four directly, as I represent below, I think it shows that Elicitation and Collaboration are performed in a cyclic manner, meaning the business analyst keeps engaging with the material with the customers and SMEs and stakeholders until everyone agrees on the results. This is why I illustrate my approach as a series of cyclic loops, where there is continuous iteration within each loop and also iteration forwards and backwards among the loops.

Let’s examine this diagram in detail. The darker blue items are the main activities in each chapter about the knowledge areas. Items 4.1, 4.2, and 4.3 involve preparing for elicitation, doing elicitation, and confirming the iteration, along with the lighter blue outputs that serve as the inputs for the next activity. I show them arranged in a circle, and have included a hatched arrow that isn’t described in the BABOK, to show that these activities proceed iteratively until full understanding or agreement is reached.

Item 4.4 involves communicating business analysis information. I always thought of this as sharing the outputs of the above cycle with the other stakeholders that weren’t involved in the given phase, but the BABOK show it as being a somewhat more independent activity.

Item 4.5 is about communicating with stakeholders, and that applies to almost everything that business analysts do. Looking at the representation of my six-cycle approach at the top of this post, it should be understood that the iterations in each cycle not only represent the work done by the BAs (and other practitioners), but also the communication and engagement with the stakeholders, and the internal communications and practices of the teams doing the work in each phase. The last clause may be understood more clearly if you think of a team from an external consultant or vendor providing goods and services to stakeholders in a customer organization. This naturally applies to all different kinds of practitioners working inside a single organization.

The form the iteration takes is different in each phase. In the intended use (problem definition), conceptual model, and requirements phases, the BAs are learning from the SMEs, and iterating until until they’ve demonstrated that they have developed a comprehensive and accurate conception of the current state and requirements for the future state. The flow is somewhat reversed in that the BAs are helping the designers, implementers, and testers deliver robust, working solutions that give the customers and stakeholders the solutions they need to do their work more efficiently and effectively.

Posted in Tools and methods | Tagged , , | Leave a comment

Roadmaps to Get Your Agile Transformation Out of the Ditch

My friend Mathew McConnell gave this excellent presentation for the Pittsburgh IIBA chapter this evening. The slides may be found here, and I encourage you to review the entire deck.

I’ve never spoken or written on this subject, but Matt covers it really well so I’m just going to review what he shared. I have been around this for years so I know he’s on target. One thing that makes this so clear for me is that I’ve been on program teams and product teams as well as on project teams (in almost every role), so I’ve had plenty of chances to see how products are managed, grow, and improve in response to customer needs and opportunities created by technological advancement.

Given the above, we might consider an ongoing effort where the backlog is always prioritized and always contains items that will be addressed in the near, medium, and long terms. Items are better defined that will be worked on soonest (or are being worked on right now!), and tend to be increasingly less well defined going farther ahead in time. Items are clarified and progressively elaborated as they move forward in the backlog and actually get worked on in turn.

There are many ways to communicate this information to different participants, but I tend to prefer just enumerating high level features in time-boxed buckets moving into the future. The priority of items will be determined by continuous review of the backlog by the product owner as he or she works with customers, internal teams, and other stakeholders. The information can come from any type of future work repository (e.g., Jira, MS Project, and so on). Here are some examples from Matt’s talk.

You can see that roadmaps can be conceptually organized by many different criteria. Many others are possible, especially if they are targeted to different audiences (e.g., developers, testers, managers, users, and so on).

Roadmaps apply in almost any management paradigm (Waterfall, Agile, hybrid, modification vs. from-scratch), but really shine over longer periods of time.

We learn from the study of economics that human wants are infinite and resources are inherently finite. Roadmaps are a good way to negotiate and communicate the choices you make.

Posted in Tools and methods | Tagged , , , , | Leave a comment

BA Webinar Series 11: Management Observations and Agile Deep Dive

Today I gave this webinar for the Tampa IIBA Lunch and Learn Series. The slides are here.

Posted in Tools and methods | Tagged , , , , , , , | Leave a comment

BA Webinar Series 09a: How to Unsnarl A Problem When You’re Dropped In the Middle of It

Today I gave this webinar for the Tampa IIBA Lunch and Learn Series. The slides are here.

Posted in Tools and methods | Tagged , , , , , | Leave a comment

BA Webinar Series 10: Business Analysis Overlaps with Other Practice Areas

Today I gave this webinar for the Tampa IIBA Lunch and Learn Series. The slides are here.

Posted in Tools and methods | Tagged , , , , , , , , , , , | Leave a comment

This Era’s “Great Project,” Revisited

The first post I wrote here, close to six years ago now, talked about a friend who bemoaned the fact that he wasn’t working on something singularly and identifiably great. My contention then was that, while the specific work wasn’t seen as great by the average person, it was indeed great because of its place in the larger sweep of history.

Yeah, yeah, I know this is bordering on sententious twaddle, but stay with me here. 😄

I took a lot of interesting notes while reviewing forty hours of material last week to renew my Scrum certifications, and I’ll write about and talk about those going forward, but today I wanted to highlight one particular idea. The specific thing that jumped out at me was the feeling that the conception, design, building, maintenance, and administration of ever larger, longer-to-build, longer-lasting, and more complex software systems is teaching humanity a lot about communication, organization, cooperation, adaptability, robustness, mutual respect and support, and belonging, and that’s an exciting thing to be a part of.

But then I thought, how much of this is really new? Large groups of people have always been organized to accomplish various ends, with examples being the pyramids and other great monuments and structures, military forces, government bureaucracies, and corporations. Indeed, the Tower of Babel story from the Christian Bible is all about the limits of how large a group can get before it becomes unmanageable. Certainly there have been large scale modern efforts like the space program and current infrastructure projects, and it’s clear that smart people have always been trying to organize them better.

I recently read an article, which I can no longer locate but will link here if I find it, that (I think) described how Michelangelo used a very flexible, adaptive process as he was guiding the construction of St. Peter’s Basilica. (Edit 6/7/2023: see here and here.) A number of architects had worked on the design over a long period of time (one of whom built wooden models for seven years before being replaced), but what made Michelangelo different was that he arranged the work in a way that allowed things to be tried by actually being built, but then quickly disassembled and changed, if necessary, after quickly seeking feedback from the extant Pope. This ensured that work was always directed toward the actual construction and not endless models and drawings that didn’t give true understanding of the reality. This example may not be about organizing large groups of people, but it is about finding efficient ways to seek and act on continuous feedback. As this was the last great project of Michelangelo’s career, he had doubtless learned an awful lot about what worked and didn’t work in the service of making his customer happy. His assistant was left to carry on after the his death, and continued to make changes in response to feedback, even as he worked mostly according to the master’s plans.

A large military force might be thought of as the most hierarchical thing you can think of, right? But there are hierarchies and there are hierarchies. General George S. Patton, in leading the Allied forces toward Berlin in the latter stages of World War II, said “Never tell people how to do things. Tell them what to do and they will surprise you with their ingenuity.” I once suggested to my favorite platoon sergeant that the US military would be better than the Soviet military because our troops are trained to be more independent. He retorted, correctly, I think, that in a situation where people find themselves without their assigned commanders, “a leader will emerge,” and they’ll carry on with their full intelligence and capabilities. Bad things happen when control is held too tightly, as in the case where German commanders were afraid to act without direct permission from a sleeping and not-to-be-disturbed Hitler (at least as depicted in the movie The Longest Day) as the Allied forces landed at Normandy. The takeaway here is that organizations need to be flexible and adaptive enough to utilize the best ideas and energies of all participants. Those that do this better will tend to succeed; those that do this poorly will tend to fail.

Steve Jobs said similarly, applicable to a corporate setting, “It doesn’t make sense to hire smart people and tell them what to do; we hire smart people so they can tell us what to do.”

Here’s a description I wrote about a client’s existing process my company automated:

The company’s original process was fascinating. They had a formal system arranging documents in customized, 3–section folders representing each person in the company being considered for insurance coverage. All documents were punched with two holes near the top and were secured in the folders by built-in brass paper fasteners. The company then had a system for gathering the folders for all of a company’s employees and shuffling them around en masse so they could be processed by different groups of employees. The individual folders would be scored by the underwriters themselves, and would sometimes be routed to staff physicians or to personnel who would contact the employee’s doctors to ask questions about things in their medical records. (Since the personnel making these calls were not medically trained this sometimes annoyed the physicians they called.) The whole process was extremely clever and it was amazing what they had been able to accomplish with just folders, labels, and pushcarts. If you’ve read any of Jack L. Chalker’s Well of Souls series of science fiction novels you may remember that some of the regions on the planet where most of the action takes place were subject to various limits on the technology that was allowed to work. In particular he described a race of frog-like beings called the Makiem who lived in a low-tech region that only allowed muscle, wind, and water power. Nonetheless they had arranged a system of tubes and ramps that supported a semblance of advanced communication, distribution, and movement. It was not so long ago that all businesses and organizations had to operate using similar methods. The advent of computers has wrought a world of change.

Charles Darwin’s observations of natural phenomena led him to gel the impressions of his age into one of the most powerful insights in human history, that of self-organizing systems and emergent order. He didn’t necessarily put his findings into those words, but his many successors did, including the great economist Ludwig von Mises (though one of his students, Friedrich Hayek, is often given more credit for this line of thinking). These insights are being leveraged increasingly by managers, organizations, and agile practitioners to create working groups that are ever flatter, more autonomous, and self-organizing. It’s a big and often scary leap, but it’s an extension that goes beyond what has come before, and that’s the exciting part.

It seems that every generation has to learn from the wisdom of the past and adapt it for its own use. Technology may change, but the basic problems of life and human nature never do.

Posted in Management | Tagged , , , , | Leave a comment

Bringing Order to Collections and Systems

I’ve recently been putting together a bunch of related thoughts about how I do some parts of systems analysis and design. They involve bringing order to collections of items, data, actions, and ideas. I’ve written about one of the ideas explicitly before and touched on a couple of others. Here I wanted to go into detail.

Collections and Systems

So what are we trying to bring order to? Writing from the point of view of a business analyst or systems analyst it’s clear that this comes up in the course of our work. The collections of stuff we run into are part of the systems we are called upon to analyze, build, and improve.

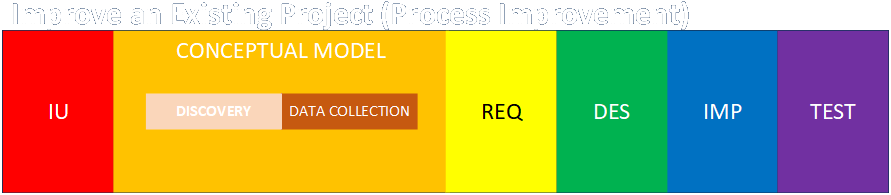
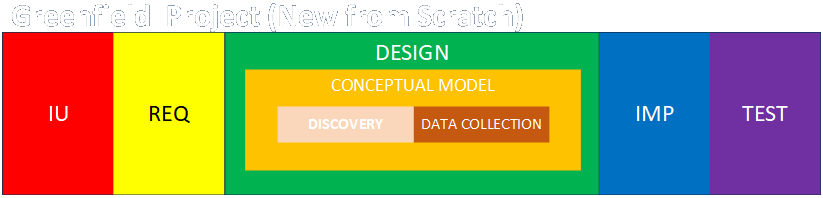
The raw material of our analyses is gathered through various processes of discovery (identifying the nouns and verbs of what’s going on, see here, here, here, here, and here), and data collection (identifying the adjectives and adverbs that characterize what’s going on, see here, here, and here). As I’ve noted previously, discovery comes first so you know what data you need to collect.

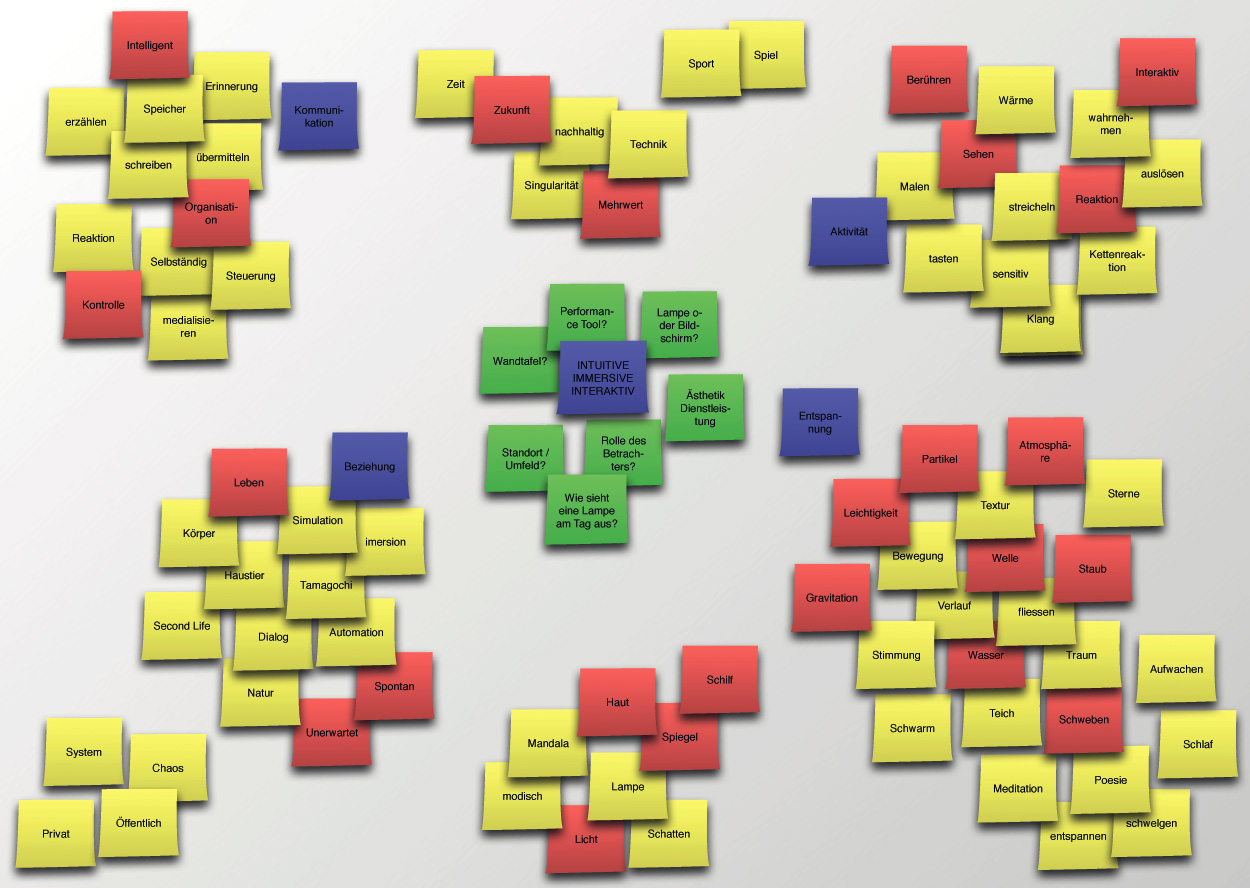
The articles in the links describe many ways analysts learn about the items and processes under study, but I want to add a very important one: brainstorming. This is where people sit together and just vomit out every relevant thought they can about the subject under study. The interesting thing about this technique is that it usually, but not always, involves an associated step of grouping the ideas that seem somehow related.

Finding Commonalities

Here are just a few examples of how people find commonalities.

Frank Bunker and Lillian Moller Gilbreth, whom you may know from the book Cheaper By the Dozen, were pioneers of industrial management and time and motion studies. Through extensive observation they were able to identify a number of simple hand movements that manufacturing workers used in different combinations, and this insight was an important step in making processes more efficient, comfortable, and safe. These basic movements came to be called therbligs, based on reversing the spelling of Frank’s last name.

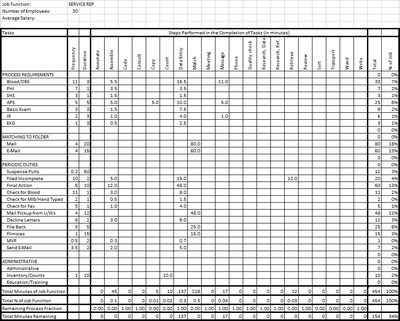
When I did business process reengineering for FileNet implementations, part of the analysis I learned to do involved identifying similar operations that workers performed in different processes (I’ll call these departments) in the operation. The figure below shows an analysis of all operations identified in a particular department (each of which may have involved up to about fifty workers, as I recall), and the time per worker per day spent on each. The rows identify the unique operations performed by the workers in that department, so all rows have data associated with them. The columns characterized the general type of each operation. Since this list included all types of operations performed by workers in all departments of the overall process, not every column had entries for every department, but every column had entries in the grid for at least one department. It was the information in the columns that allowed us to determine which operations could be automated, and thus how much time and money could be saved. It also allowed us to quantify the new operations that had to be added to the reengineered process, the number of workers and computers required, and their ultimate cost.

I often say that a business or systems analyst is a kind of learning machine, since they have to learn the particulars of the specific things they are analyzing, but they also have to be communication and translation machines. That is, they have to be able to talk to a lot of different of people about a lot of different things, and somehow get them to understand each other. The more the analyst knows about everyone’s job and concerns, the better job the analyst can do.

He is a basic communication model I learned in a leadership school in the Army.

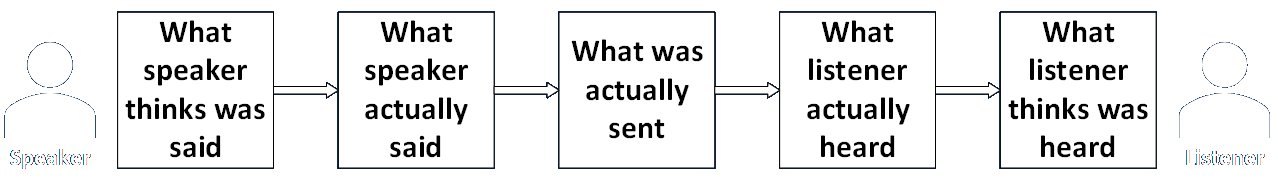
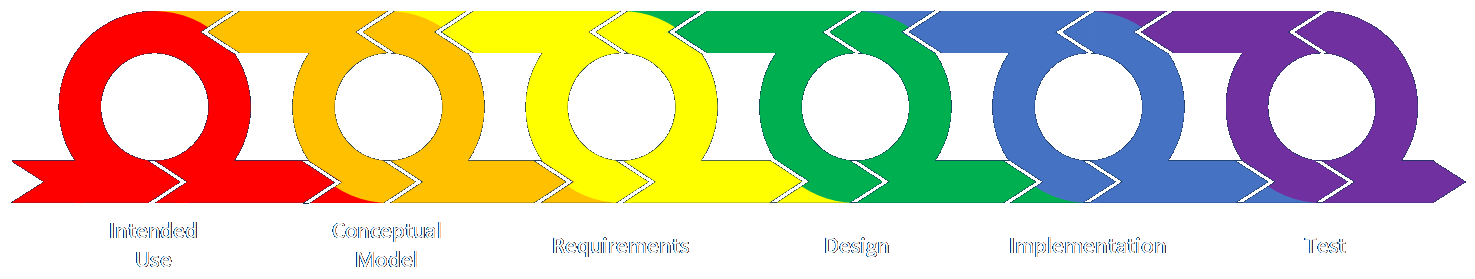
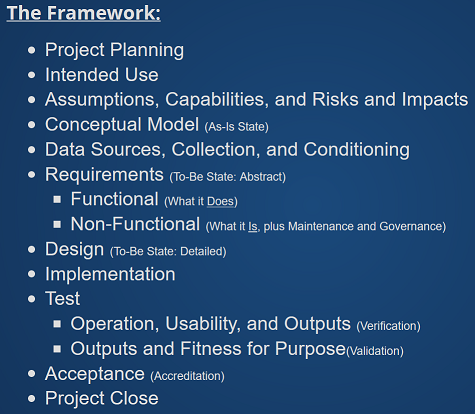
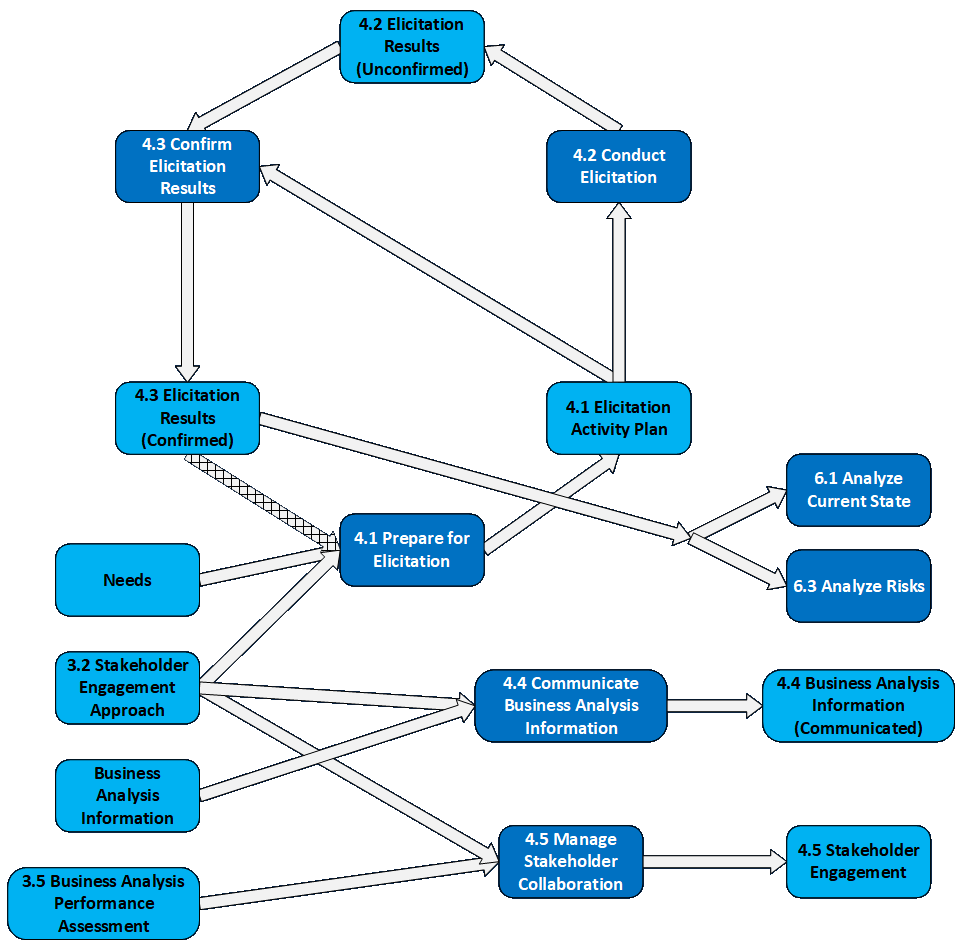
Potentially different techniques can be used to improve each step in the communication process, and this applies whether the communication is in person or electronic. One of the key things is verifying the integrity of each message, and retrying the message as needed until all parties agree that a shared understanding has been achieved. I describe this for electronic communication here (see references to retries), but for people trying to work together through a problem-solving engagement, I refer to the core iterative cycle in my analytic framework, as shown below.

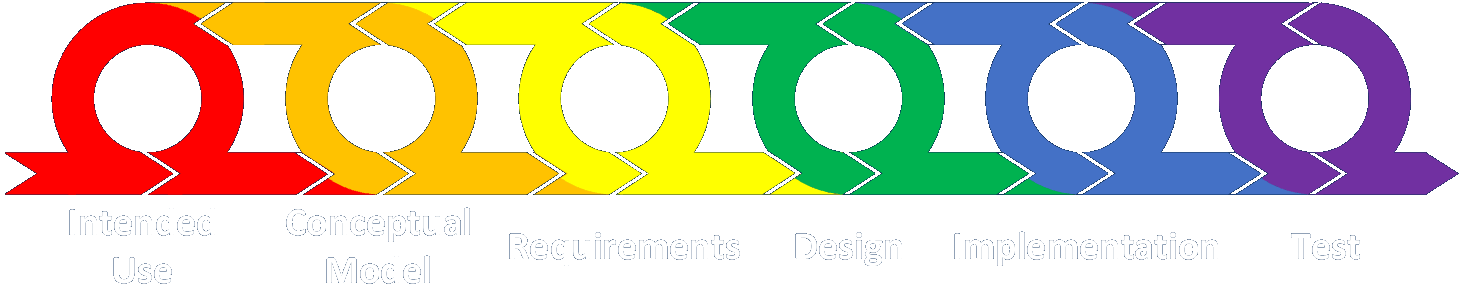
This iterative process helps build understanding, trust, buy-in, and ideally enthusiasm from all participants, and is a form of finding common ground — or commonalities — between people.

Common themes are a hallmark of great literature. While Neal Stephenson’s Cryptonomicon may not be everyone’s idea of great literature, a lot of people think it’s pretty decent science fiction. The story draws parallels between cracking codes in wartime, industrial communications, and interpersonal relationships.

When I was about fourteen I tried to list all the different pieces of Lego I had collected. It wasn’t enough to just list them, though. My precocious, nerdy little self had to try to organize everything into some kind of a taxonomic hierarchy, and that’s where the project hit a snag. Which characteristics would be higher in the hierarchy? Color? Shape? Number and configuration of studs? Height? Something else? I remember that I chose some sort of precedence, but I’m pretty sure I was never really happy with it. Later on I learned about databases, programming, and the ability to sort, display, and analyze flexibly depending on the specific problems at hand. That made me feel a lot better about things.

I didn’t go back, enter all my Lego pieces into an Access database and run a bunch of different reports on them, but these experiences were formative and illuminating. For this conversation, it illustrates that there are many different kinds of commonalities to find. Which ones you find should emerge from the nature of each problem.

The foregoing is an example of there being several possible ways to classify items. By contrast, the Big Five personality traits were identified using only one type of classifying mechanism. As I understand it, they were derived by identifying every possible adjective people can use to describe aspects of a personality, and then a factor analysis was performed on each pair of words (I presume in every combination) to determine the degree to which they were related. When these were analyzed (I don’t profess to know how they did it), the adjectives seemed to fall into five distinct clusters. As someone who’s long been interested in Myers-Briggs personality typing (itself based on the work of Carl Jung), I’ve found this to be quite interesting.

Modularity

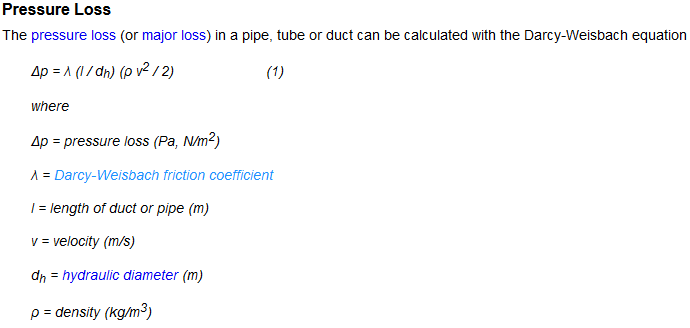
As someone who has not only designed and built simulations, but also tools to build simulations, I have a keen appreciation for identifying opportunities to build the smallest number of unique components that can be customized to represent the widest range of entities or processes. I’ve discussed the basic components germane to the creation of discrete-event simulation models here. I documented the creation of my discrete-event simulation demo here, including 91 blog posts. I did something similar when I built a tool to document and calculate coefficients for fluid models.

Being able to identify, design, and implement reusable and reconfigurable components makes systems and architectures much more robust, understandable, documentable, testable, and so on. Said another way, it is a boon to improvement in terms of non-functional requirements.

Rationalization

Finding commonalities can help in the creation of modular designs, but it can bring order to situations in other ways. The best general word I can come up with to describe this process is rationalization. (In a good way, not as Jeff Goldblum’s character invokes the word in the movie The Big Chill.)

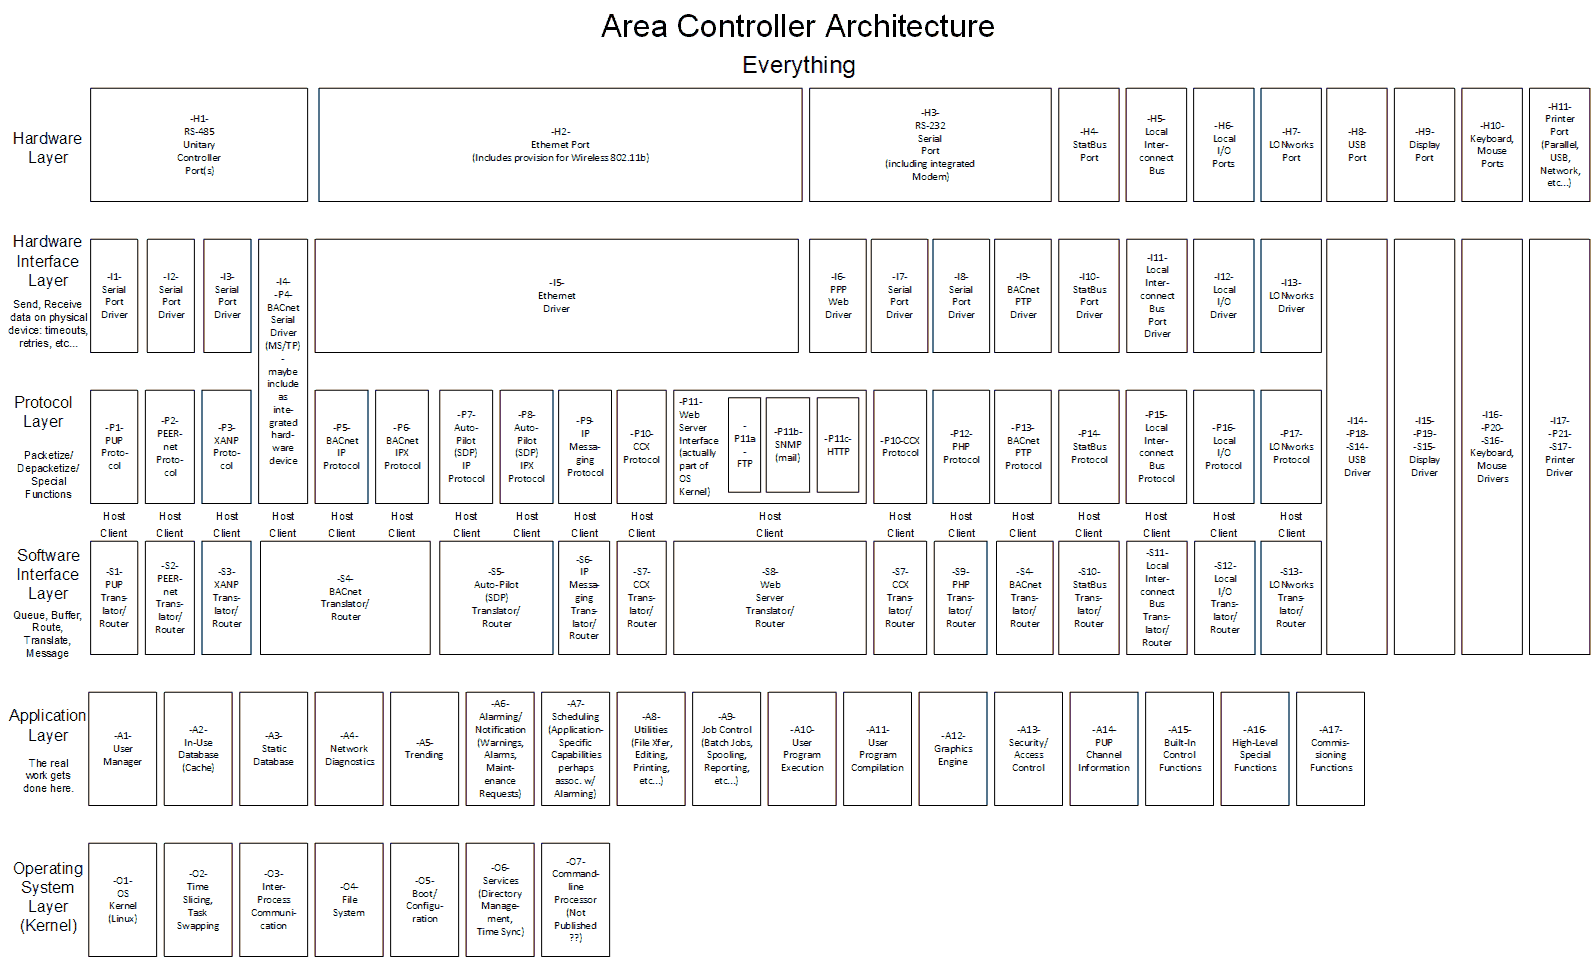
I analyzed the product line of controllers and software for HVAC systems to clearly identify what we had, which existing products should be maintained, which features could be added, and what made sense to develop as new products.

As part of this I identified most pieces of communication and functional capability in two dimensions (heirarchal layers on the vertical, protocol or function on the horzontal) on a Visio drawing, and then I created layers for each product the company made, where the relevant elements could be turned on and off as the analysis proceeded. That pointed to ways to make the existing product line more uniform and where it made sense to add new protocols and develop new products entirely. As I review this now, this could have been accomplished a bit more easily and compactly using a spreadsheet.

Sometimes rationalization just means figuring out ways for people to find things. I describe my proposals for monitoring an entire microservices stack across five levels here. This proposal grew out of the need to make the system understandable and manageable, because it was a total fire drill when anything went wrong, with people needing to scatter all over the place to figure out what was happening. This could have been avoided if the information and tools had been organized and placed in a known location where they could be readily accessed and controlled.

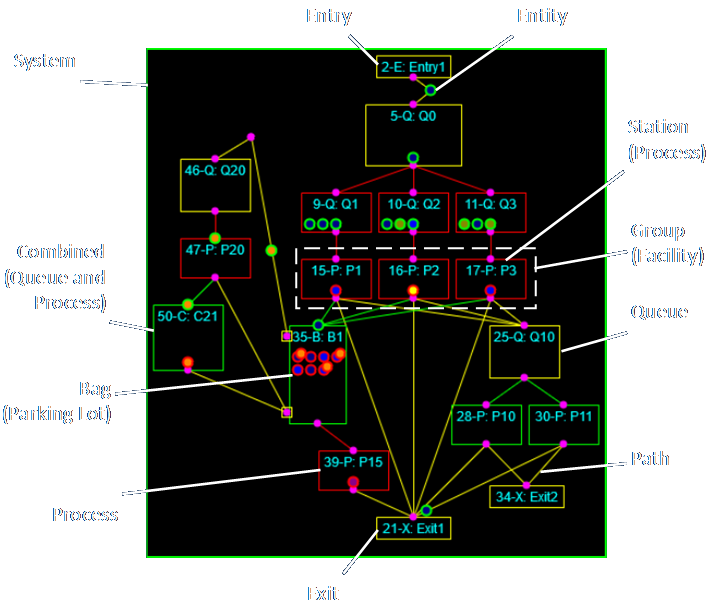
I linked to the discrete-event simulation tool I developed as a proof-of-concept (and proof-that-I-could-develop-in-JavaScript) demo above. Each component was different, but I wanted to ensure they implemented similar features in the same way. Here is one discussion that describes a sliver the process I went through (note that the images are scrollable).

Any form of automation can be thought of as a kind of rationalization, because it tends to make each repetition of an action more consistent and repeatable. If structured properly, this can also help reduce errors, build understanding, and improve situational awareness.

As you can see, rationalization can take many forms. It’s just a form of putting things in order — while simultaneously making them consistent — in a way that make sense for each situation.

Final Thoughts

My desire, when I get the chance to make it happen, is to have other people understand that these processes are similar to those of the iterative customer/team feedback cycle I mention above (and often), in that one is always aware of the full process going in and tries to make use of this knowledge throughout any work effort.

It can take the form of getting practitioners to use similar methods and best practices across different activities, can be supported via internal and external communities of practice, and be facilitated by information shared in meetings and through websites and shared communication portals like Confluence and Slack, among many others.

If you can think of any other examples of how you’ve done this, and what did or didn’t work for you, I’d love to hear about it.

Posted in Tools and methods | Tagged , , | Leave a comment

BA Webinar Series 09: How To Unsnarl A Problem When You’re Dropped In the Middle of It

I recently gave this webinar for the Philadelphia IIBA monthly meeting. The slides are here.

Posted in Tools and methods | Tagged , , , , , | Leave a comment