
Did I know anything about microservices (or DevOps, or…) when I landed at Universal recently? No, I did not. Did that stop me from figuring it out in short order? Nope. Did that stop me from being able to reverse-engineer their code stacks in multiple languages from day one? Of course not. Did that stop me from seeing things nobody else in the entire organization saw and designing a solution that would have greatly streamlined their operations and saved them thousands of hours of effort? Not a chance. Could I see what mistakes they had made in the original management and construction of the system and would I have done it differently? You betcha.
While there are definitely specific elements of tradecraft that have to be learned to make optimal use of microservices, and there would always be more for me to learn, the basics aren’t any different than what I’ve already been doing for decades. It didn’t take long before the combination learning how their system was laid out, seeing the effort it took to round up the information needed to understand problems as they came up in the working system, and seeing a clever monitoring utility someone had created before it became obvious they needed a capability that would help them monitor and understand the status of their entire system. Like I said, it didn’t require a lot of work, it was something I could just “see.” I suggested an expanded version of the monitoring tool they’d created, that let anyone see how every part of the system worked at every level.
Now don’t get me wrong, there were a lot of smart and capable and dedicated people there, and they understood a lot of the architectural considerations. So what I “saw” wasn’t totally new in detail, but is was certainly new in terms of its scope, in that it would unify and leverage a lot of already existing tools and techniques. As I dug into what made the system tick I saw that concepts and capabilities broke down into five different layers, but first some background.
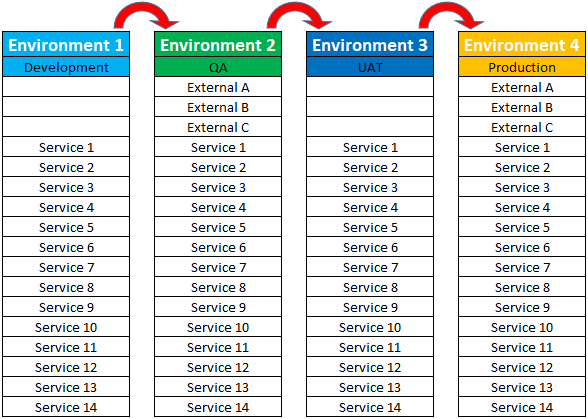
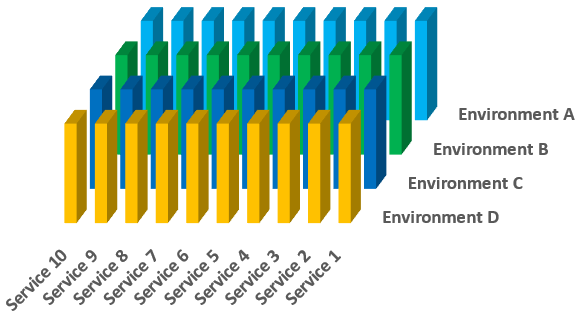
Each column in the figure above represents a single microservices environment. The rightmost column shows a production environment, the live system of record that actually supports business operations. It represents the internal microservices and the external systems that are part of the same architectural ecosystem. The external items might be provided by third-party as a standard or customized capability. They can be monitored and interacted with, but the degree to which they can be controlled and modified might be limited. The external systems may not be present in every environment. Environments may share access to external systems for testing, or may not have access at all, in which case interactions have to be stubbed out or otherwise simulated or handled.
The other columns represent other environments that are likely to be present in a web-based system. (Note that microservices can use any communication protocol, not just the HTTP used by web-facing systems. The other environments are part of a DevOps pipeline used to develop and test new and modified capabilities. Such pipelines may have many more steps, than what I’ve shown here, but new code is ideally entered into the development environment and then advanced rightward from environment as it passes different kinds of tests and verifications. There may be an environment dedicated to entering and testing small hotfixes that can be advanced directly to the production environment with careful governance.
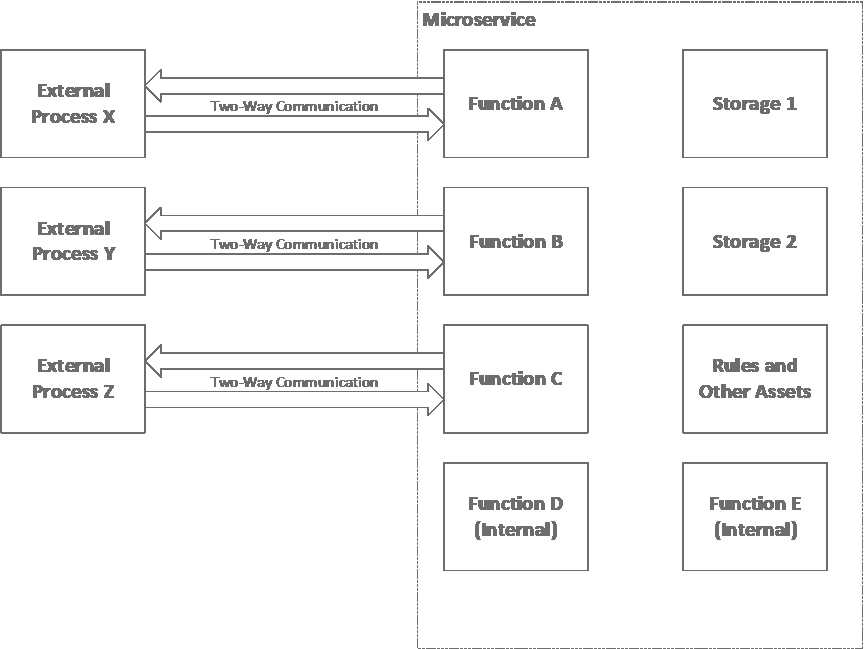
The basic structure of a microservice is shown above. I’ve written about monitoring processes here, and this especially make sense in a complicated microservices environment. I’ve also written about determining what information needs to be represented and what calculations need to be performed before working out detailed technical instantiations here. A microservice can be thought of as a set of software capabilities that perform defined and logically related functions, usually in a distributed system architecture, in a way that ideally doesn’t require chaining across to other microservices (like many design goals or rules of thumb, this regulation need not be absolute, just know what you’re trying to do and why; or, you’ve got to know the rules before you can break them!).
I’ve listed them here in the raw form in which I discovered them. I never got to work with anyone to review and implement this stuff in detail; something came up every time we scheduled a meeting, so I’ve found inconsistencies as I worked on this article. I cleaned some things up, eliminated some duplications, and made them a bit more organized and rational down below. A more detailed write-up follows.
Layer 1 – Most Concrete
Hardware / Local Environment
- number of machines (if cluster)
- machine name(s)
- cores / memory / disk used/avail
- OS / version
- application version (Node, SQL, document store)
- running?
- POC / responsible party
- functions/endpoints on each machine/cluster
Layer 2
Gateway Management (Network / Exposure / Permissioning)
- IP address
- port (different ports per service or endpoint on same machine?)
- URL (per function/endpoint)
- certificate
- inside or outside of firewall
- auth method
- credentials
- available?
- POC / responsible party
- logging level set
- permissions by user role
Level 3
QA / Testing
- tests being run in a given environment
- dependencies for each path under investigation (microservices, external systems, mocks/stubs)
- schedule of current / future activities
- QA POC / responsible party
- Test Incident POC / responsible party
- release train status
- CI – linting, automatically on checkin
- CI – unit test
- CI – code coverage, 20% to start (or even 1%), increase w/each build
- CI – SonarQube Analysis
- CI – SonarQube Quality Gate
- CI – VeraCode scan
- CI – compile/build
- CI – deploy to Hockey App for Mobile Apps / Deploy Windows
- CD – build->from CI to CD, publish to repository server (CodeStation)
- CD – pull from CodeStation -> change variables in Udeploy file for that environment
- CD – deploy to target server for app and environment
- CD – deploy configured data connection, automatically pulled from github
- CD – automatic smoke test
- CD – automatic regression tests
- CD – send deploy data to Kibana (deployment events only)
- CD – post status to slack in DevOps channel
- CD – roll back if not successful
- performance test CD Ubuild, Udeploy (in own perf env?)
Level 4
Code / Logic / Functionality
- code complete
- compiled
- passes tests (unit, others?)
- logging logic / depth
- Udeploy configured? (how much does this overlap with other items in other areas?)
- test data available (also in QA area or network/environment area?)
- messaging / interface contracts maintained
- code decomposed so all events queue-able, storable, retryable so all eventually report individual statuses without loss
- invocation code correct
- version / branch in git
- POC / responsible party
- function / microservice architect / POC
- endpoints / message formats / Swaggers
- timing and timeout information
- UI rules / 508 compliance
- calls / is-called-by –> dependencies
Level 5 – Most Abstract
Documentation / Support / Meta-
- management permissions / approvals
- documentation requirements
- code standards reviews / requirements
- defect logged / updated / assigned
- user story created / assigned
- POC / responsible party
- routing of to-do items (business process automation)
- documentation, institutional memory
- links to related defects
- links to discussion / interactive / Slack pages
- introduction and training information (Help)
- date & description history of all mods (even config stuff)
- business case / requirement for change
That’s my stream-of-consciousness take.
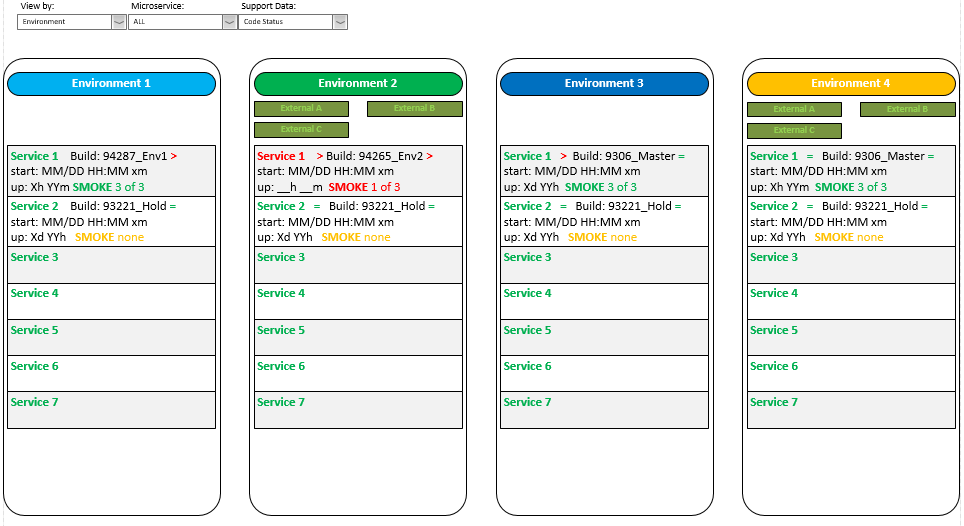
Before we go into detail let’s talk about what a monitoring utility might look like. The default screen of the standalone web app that served as my inspiration for this idea showed a basic running/not-running status for every service in every environment and looked something like this. It was straight HTML 5 with some JavaScript and Angular and was responsive to changes in the screen size. There were a couple of different views you could choose to see some additional status information for every service in an environment or for a single service across all environments. It gathered most of its status information by repeatedly sending a status request to the gateway of each service in each environment. Tow problems with this approach were that the original utility pinged the services repeatedly without much or any delay, and multiple people could (and did) run the app simultaneously, which hammered the network and the services harder than was desirable. These issues could be addressed by slowing down the scan rate and hosting the monitoring utility on a single website that users could load to see the results of the scans. That would still require a certain volume of refreshes across the network (and there are ways to even minimize those) but queries of the actual service endpoints would absolutely be minimized.
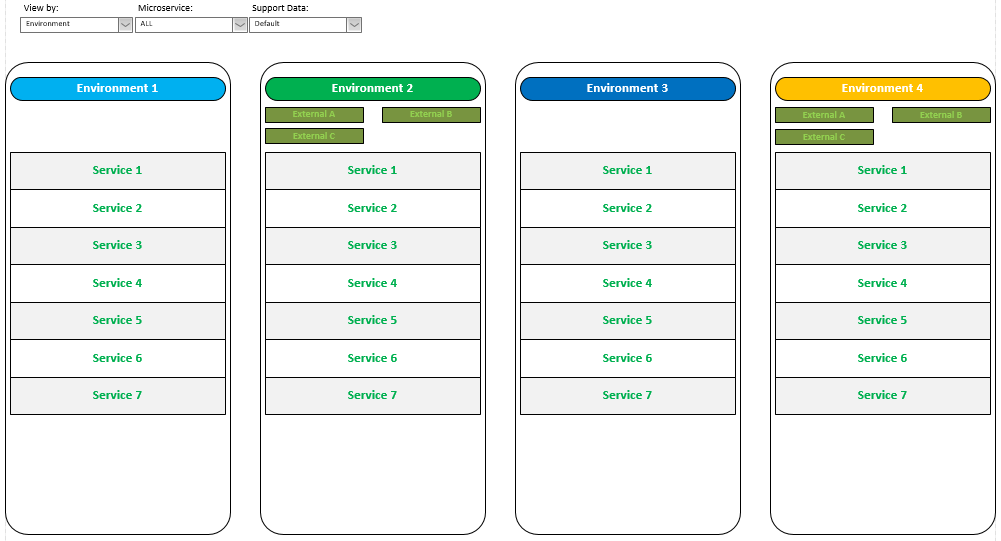
It was real simple. Green text meant the service was running and red text meant it wasn’t. Additional formatting or symbology could be added for users who are colorblind.
Now let’s break this down. Starting from the most concrete layer of information…
Layer 1 – Most Concrete
Hardware / Local Environment
This information describes the actual hardware a given piece of functionality is hosted on. Of course, this only matters if you are in control of the hardware. If you’re hosting the functionality on someone else’s cloud service then there my be other things to monitor, but it won’t be details you can see. Another consideration is whether a given collection of functionality requires more resources than a single host machine has, in which case the hosting has to be shared across across multiple machines, with all the synchronization and overhead that implies.
When I was looking at this information (and finding that the information in lists posted in various places didn’t match) it jumped out at me that there were different versions of operating systems on different machines, so that’s something that should be displayable. If the web app had a bit more intelligence, it could produce reports on machines (and services and environments) that were running each OS version. There might be good reasons to support varied operating systems and versions, and you could include logic that identified differences against policy baselines for different machines for different reasons. The point is that you could set up the displays to include any information and statuses you wanted. This would provide at-a-glance insights into exactly what’s going on at all times.
Moreover, since this facility could be used by a wide variety of workers in the organization, this central repository could serve as the ground truth documentation for the organization. Rather than trying to organize and link to web pages and Confluence pages and SharePoint documents and manually update text documents and spreadsheets on individual machines, the information could all be in one place that everyone could find. And even if separate documents needed to be maintained by hand, such a unified access method could provide a single, trusted pointer to the correct version of the correct document(s). This particular layer of information might not be particularly useful for everyone, but we’ll see when we talk about the other layers that having multiple eyes on things allows anomalies to be spotted and rectified much more quickly. If all related information is readily available and organized in this way, and if people understood how to access it, then the amount of effort spent finding the relevant people and information when things went wrong would be reduced to an absolute minimum. In a large organization the amount of time and effort that could be saved would be spectacular. Different levels of permissions for viewing, maintenance, and reporting operations could also be included as part of a larger management and security policy.
I talked about pinging the different microservices, above. That’s a form of ensuring that things are running at the application level, or the top level of the seven-layer OSI model. The status of machines can be independently monitored using other utilities and protocols. In this case they might operate at a much lower level. If the unified interface I’m discussing isn’t made to perform such monitoring directly, it could at least provide a trusted link to or description of where to access and how to use the appropriate utility. I was exposed to a whole bunch of different tools at Universal, and I know I didn’t learn them all or even learn what they all were, but such a consistent, unified interface would tell people where things were and greatly streamline awareness, training, onboarding, and overall organizational effectiveness.
- number of machines (if cluster)
- machine name(s)
- cores / memory / disk used/avail
- OS / version
- application version (Node, SQL, document store)
- running (machine level)
- POC / responsible party
- functions/endpoints on each machine/cluster
Last but not least, the information tracked and displayed could include meta-information about who was responsible for doing certain things and who to contact at various times of day and days of week. Some information would be available and displayed on a machine-by-machine basis, some based on the environment, some based on services individually or in groups, and some on an organizational basis. The diagram below shows some information for every service for every environment, but other information only for each environment. Even more general information, such as that applying to the entire system, could be displayed in the top margin.
Layer 2
Gateway Management (Network / Exposure / Permissioning)
The next layer is a little less concrete and slightly more abstract and configurable, and this involves the network configuration germane to each machine and each service. Where the information in the hardware layer wasn’t likely to change much (and might be almost completely obviated when working with third-party, virtualized hosting), this information can change more readily, and it is certainly a critical part making this kind of system work.
The information itself is fairly understandable, but what gives it power in context is how it links downward to the hardware layer and links upward to the deployment and configuration layer. That is, every service in every environment at any given time is described by this kind of five-layer stack of hierarchical information. If multiple endpoints are run on a shared machine then the cross-links and displays should make that clear.
- IP address
- port (different ports per service or endpoint on same machine?)
- URL (per function/endpoint)
- SSL certificate (type, provider, expiration date)
- inside or outside of firewall
- auth method
- credentials
- available?
- POC / responsible party
- logging level set
- permissions by user role
There are a ton of tools that can be used to access, configure, manage, report on, and document this information. Those functions could all be folded into a single tool, though that might be expensive, time-consuming, and brittle. As described above, however, links can be provided to the proper tools and various sorts of live information.
Level 3
QA / Testing
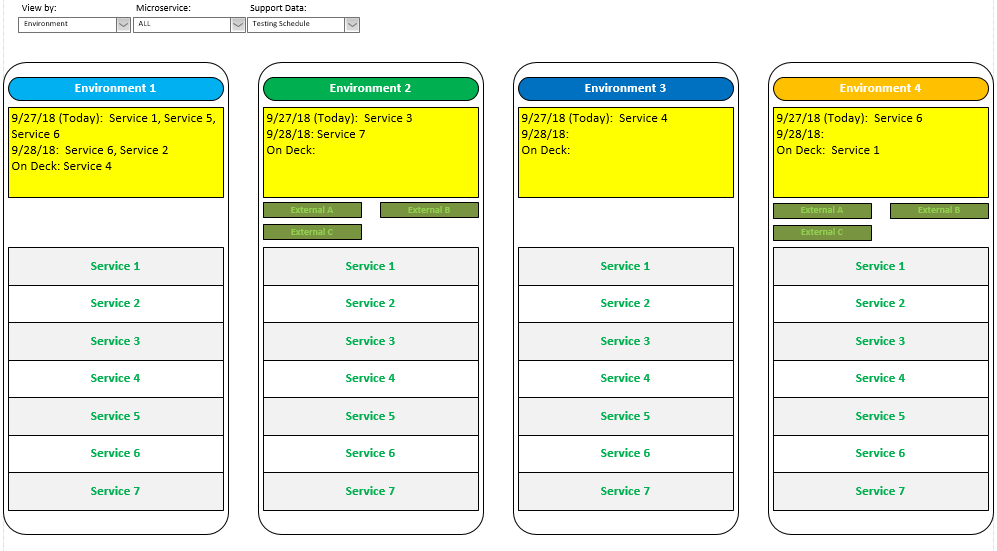
Getting still more abstract, we could also display the status of all service items as they are created, modified, tested, and moved through the pipeline toward live deployment. The figure below shows how the status of different build packages could be shown in the formatted display we’ve been discussing. Depending on what is shown and how it’s highlighted, it would be easy to see the progress of the builds through the system, when each code package started running, the status of various test, and so on. You could highlight different builds in different colors and include extra symbols to show how they fit in sequence.
- tests being run in a given environment
- dependencies for each path under investigation (microservices, external systems, mocks/stubs)
- schedule of current / future activities
- QA POC / responsible party
- Test Incident POC / responsible party
- release train status
- CI – linting, automatically on checkin
- CI – unit test
- CI – code coverage, 20% to start (or even 1%), increase w/each build
- CI – SonarQube Analysis
- CI – SonarQube Quality Gate
- CI – VeraCode scan
- CI – compile/build
- CI – deploy to Hockey App for Mobile Apps / Deploy Windows
- CD – build->from CI to CD, publish to repository server (CodeStation)
- CD – pull from CodeStation -> change variables in Udeploy file for that environment
- CD – deploy to target server for app and environment
- CD – deploy configured data connection, automatically pulled from github
- CD – automatic smoke test
- CD – automatic regression tests
- CD – send deploy data to Kibana (deployment events only)
- CD – post status to slack in DevOps channel
- CD – roll back if not successful
- performance test CD Ubuild, Udeploy (in own perf env?)
A ton of other information could be displayed in different formats, as shown below. The DevOps pipeline view shows the status of tests passed for each build in an environment (and could include every environment, I didn’t make complete example displays for brevity, but it could also be possible to customize each display as shown). These statuses might be obtained via webhooks to the information generated by the various automated testing tools. As much or as little information could be displayed as desired, but it’s easy to see how individual status items can be readily apparent at a glance. Naturally, the system could be set up to only show adverse conditions (tests that failed, items not running, permissions not granted, packages that haven’t moved after a specified time period, and so on).
A Dependency Status display could show what services are dependent on other services (if there are any). This gives the release manager insight into what permissions can be given to advance or rebuild individual packages if its clear there won’t be any interactions. It also shows what functional tests can’t be supported if required services aren’t running. If unexpected problems are encountered, in functional testing it might be an indication that the messaging contracts between services needs to be examined, it something along those lines was missed. In the figure below, Service 2 (in red) requires that Services 3, 5, and 9 must be running. Similarly, Service 7 (in blue) requires that Services 1, 5, and 8 are running. If any of the required services aren’t running then meaningful integration tests cannot be run. Inverting that, the test manager could also see at a glance which services could be stopped for any reason. If Services 2 and 7 both needed to be running, for example, then services 4 and 6 could be stopped without interfering with anything else. There are doubtless more interesting, comprehensive, and efficient ways to do this, but the point is merely to illustrate the idea. This example does not show dependencies for external services, but those could be shown as well.
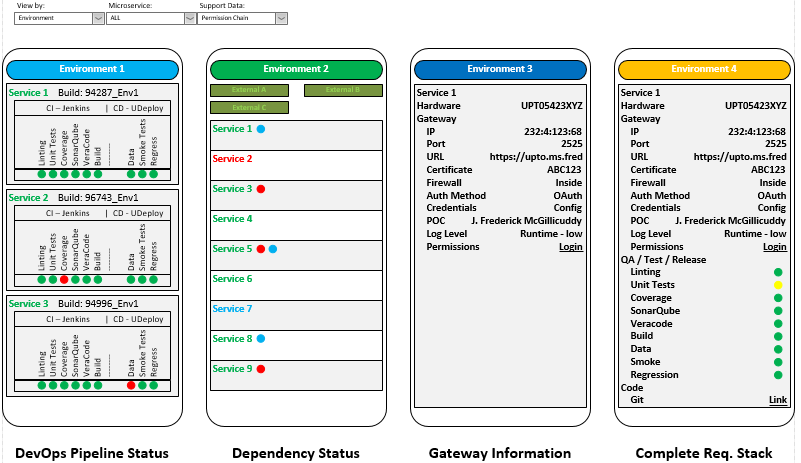
The Gateway Information display shows how endpoints and access methods are linked to hardware items. The Complete Requirements Stack display could show everything from the hardware on up to the management communications, documentation, and permissioning.
The specific tools used by any organization are likely to be different, and in fact are very likely to vary within an organization at a given time (Linux server function written in Node or Java, iOS or Android app, website or Angular app, or almost any other possibility), and will certainly vary over time as different tools and languages and methodologies come and go. The ones shown in these examples are notional, and different operations may be performed in different orders.
Level 4
Code / Logic / Functionality
The code, logic, and style is always my main concern and that most matching my experience. I interacted with people doing all these things, but I naturally paid closest attention to what was going on in this area.
- code complete: flag showing whether code is considered complete by developer and submitted for processing.
- compiled: flag showing whether code package is compiled. This is might only apply to the dev environment if only compiled packages are handled in higher environments.
- passes tests (unit, others?): flag(s) showing status of local (pre-submittal) tests passed
- logging logic / depth: settings controlling level of logging of code for this environment. These settings might vary by environment. Ideally, all activity at all levels would be logged in the production environment, so complete auditing is possible to ensure no transactions ever fail to complete or leave an explanation of why they did not. Conversely, more information might be logged for test scenarios than for production. It all depends on local needs.
- Udeploy configured: Flag for whether proper deployment chain is configured for this code package and any dependencies. (How much does this overlap with other items in other areas?)
- test data available : Every code package needs to have a set test data to run against. Sometimes this will be native to automated local tests and at other times will involved data that must be provided by or available in connected capabilities through a local (database) or remote (microservice, external system, web page, or mobile app) communications interface. The difficulty can vary based on the nature of the data. Testing credit card transactions so all possible outcomes are exercised is a bit of a hassle, for example. It’s possible that certain capabilities won’t be tested in every environment (which might be redundant in any case), so what gets done and what’s required in each environment in the pipeline needs to be made clear.
- messaging / interface contracts maintained: There should be ways to automatically test the content and structure of messages passed between different functional capabilities. This can be done structurally (as in the use of JavaScript’s ability to query an object to determine what’s in it to see if it matches what’s expected, something other languages can’t always do) or by contents (as in the case of binary messages (see story 1) that could be tested based on having unique data items in every field). Either way, if the structure of any message is changed, someone has to verify that all code and systems that use that message type are brought up to date. Different versions of messages may have to be supported over time as well, which makes things even more complicated.
- code decomposed so all events queue-able, storable, retryable so all eventually report individual statuses without loss and so that complete consistency of side-effects is maintained: People too often tend to write real-time systems with the assumption that everything always “just works.” Care must be taken to queue any operations that fail so they ccan be retried until they pass or, if they are allowed to fail legitimately, care must be taken to ensure that all events are backed out, logged, and otherwise rationalized. The nature of the operation needs to be considered. Customer facing functions need to happen quickly or be abandoned or otherwise routed around while in-house supply and reporting items could potentially proceed with longer delays.
- invocation code correct: I can’t remember what I was thinking with this one, but it could have to do with the way the calling or initiating mechanism works, which is similar to the messaging / interface item, above.
- version / branch in git: A link to the relevant code repository (it doesn’t have to be git) should be available and maintained. If multiple versions of the same code package are referenced by different environments, users, and so on, then the repository needs to be able to handle all of them and maintain separate links to them. The pipeline promotion process should also be able to trigger automatic migrations of code packages in the relevant code repositories. The point is that it should be easy to access thhe code in the quickest possible way for review, revision, or whatever. A user shouldn’t have to go digging for it.
- POC / responsible party: How to get in touch with the right person depending on the situation. This could include information about who did the design, who did the actual ccoding (original or modification), who the relevant supervisor or liaison is, who the product owner is, or a host of other possibilities.
- function / microservice architect / POC: This is just a continuation of the item above, pointing to the party responsible for an entire code and functionality package.
- endpoints / message formats / Swaggers: This is related to the items about messaging and interface contracts but identifies the communication points directly. There are a lot of ways to exercise communication endpoints, so all could be referenced or linked to in some way. Swaggers are a way to automatically generate web-based interfaces that allow you to manually (or automatically, if you do it right) populate and send messages to and receive and display messages from API endpoints. A tool called Postman does something similar. There are a decent number of such tools around, along with ways to spoof endpoint behaviors internally, and I’ve hand-written test harnesses of my own. The bottom line is that more automation is better, but the testing tools used should be described, integrated, or at least pointed to. Links to documentation, written and video tutorials, and source websites are all useful.
- timing and timeout information: The timing of retries and abandonments should be parameterized and readily visible and controllable. Policies can be established governing rules for similar operations across the entire stack, or at least in the microservices. Documentation describing the process and policies should also be pointed to.
- UI rules / 508 compliance: This won’t apply to back-end microservices but would apply to front-end and mobile codes and interfaces. It could also apply to user interfaces for internal code.
- calls / is-called-by –> dependencies: My idea is that this is defined at the level of the microservice, in order to generate the dependency display described above. This might not be so important if microservices are completely isolated from each other, as some designers opine that microservices should never call each other, but connections with third-party external systems would still be important.
- running (microservice/application level): indication of whether the service or code is running on its host machine. This is determined using an API call.
Level 5 – Most Abstract
Documentation / Support / Meta-
- management permissions / approvals
- documentation requirements
- code standards reviews / requirements
- defect logged / updated / assigned
- user story created / assigned
- POC / responsible party
- routing of to-do items (business process automation)
- documentation, institutional memory
- links to related defects
- links to discussion / interactive / Slack pages
- introduction and training information (Help)
- date & description history of all mods (even config stuff)
- business case / requirement for change: linked forward and backward as part of the Requirements Traceability Matrix.
While the lower levels are more about ongoing and real-time status, this level is about governance and design. Some of the functions here, particularly the stories, defects, tracking, and messaging, are often handled by enterprise-type systems like JIRA and Rally, but they could be handled by a custom system. What’s most important here is to manage links to documentation in whatever style the organization deems appropriate. Definition of done calculations could be performed here in such a way that builds, deployments, or advancements to higher environments can only be performed if all the required elements are updated and verified. Required items could include documentation (written or updated, and approved), management permission given, links to Requirements Traceability Matrix updated (especially to the relevant requirement), announcements made by environment or release manager or other parties, and so on.
Links to discussion pages are aslo important, since they can point directly to the relevant forums (on Slack, for example). This makes a lot more of the conversational and institutional memory available and accessable over time. Remember, if you can’t find it, it ain’t worth much.
Visually you could think of what I’ve described looking like the figure below. Some of the information is maintained in some kind of live data repository, from which the web-based, user-level-access-controlled, responsive interface is generated, while other information is accessed by following links to external systems and capabilities.
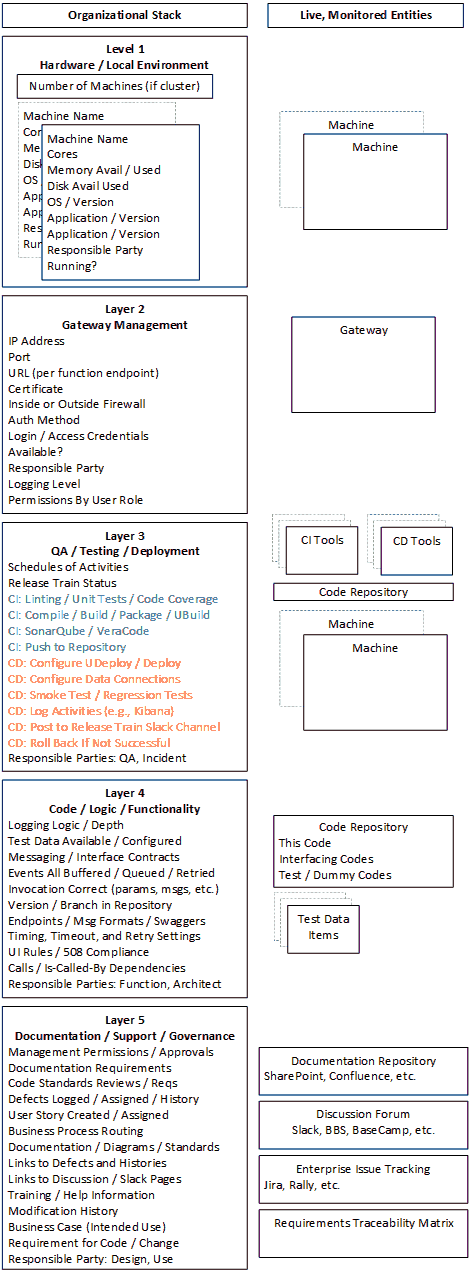
And that’s just the information for a single service in a single environment. The entire infrastructure (minus the external systems) contains a like stack for all services in all environments.
There’s a ton more I could write about one-to-many and many-to-one mapping in certain situations (e.g., when multiple services run on a single machine in a given environment or when a single service is hosted on multiple machines in a given — usually production — environment to handle high traffic volumes), and how links and displays could be filtered as packages moved through the pipeline towards live deployment (by date or build in some way), but this post is more than long enough as it is. Don’t you agree?