
Discovery is observing or researching what’s in a system or process. It identifies facilities, entities, resources, information, and activities. These are the nouns and verbs that comprise the system or process under investigation.
Discovery does not try to quantify the details of the process, which can be thought of as the adjectives and adverbs of the system or process. It merely identifies what happens to what, who does it, where things go, and how transformations are effected. These processes can sometimes be performed simultaneously, but for the most part discovery is done first so you know what quantification needs to be done. I refer to that quantification work as data collection and will describe it in detail in a separate post.
Discovery and data collection are both carried out using the techniques of subject matter expert interviews and observation. Focus groups, workshops, and document reviews can be used to a lesser degree. Although discovery and data collection are carried out the using some of the same techniques as elicitation (interviews, focus groups, and workshops), I think of elicitation as a way to identify needs rather than learn what’s going on. Focus groups and workshops are a form of group interview and these are sometimes called JAD or Joint Application Design sessions.
Discovery takes place in two possible contexts, with one being far more important than the other. The less important context involves creating an entirely new process, where you are working backwards from the desired outcomes and discovering what steps are needed to produce them. That process is more formally, and correctly, known as design. That effort is almost always performed in tandem with a form of data collection, since the “discovered” process must be parameterized to test its effectiveness. The more important context is that of an analyst coming on to an existing system that needs to be improved or adapted to a new situation. In this case the system or process already exists, and discovery refers to the analyst learning about it.
Adapting a process or system to a new situation turns out to be quite a broad area. For example, in the paper industry I worked for a capital equipment vendor of pulping equipment. If I was visiting an existing mill to do a performance audit or improvement review I would learn about the system what was already in place through review of drawings, walking the plant, and getting guided tours from plant personnel. That’s pretty straightforward. However, when designing a new process for a potentially new mill, I wasn’t really designing a new process from scratch. I was instead using the equipment that makes up a standard pulping system and applying variations (in equipment and sub-process types, size and model and number of pieces of each type of equipment, chemical and thermal treatments, and so on) that met the customers’ specifications. Similarly, when I worked as a business process reengineering specialist I was automating existing manual systems by applying a standard set of tools and techniques, which included FileNet document imaging hardware and software.
It’s rare that analysts and designers get to approach new problems with and entirely clean slate, so perhaps it is better to think of discovery as taking place on a continuum of how well defined the initial process is that an analyst will try to improve, automate, or implement.
Here’s how I approached discovery activities at various jobs and on various projects:
Sprout-Bauer (now Andritz)
Discovery
I divided my time into auditing and improving existing systems and designing and sizing new systems. Discovery for me took place mostly when performing audits and performance reviews. In order to prepare for each analysis I would review the relevant P&IDs (Process and Instrumentation Drawings) before leaving the office and I would walk the process first thing upon arriving at the plant. Walking the process was especially important because I often had to locate the sample ports I’d need to use to collect materials to send back to the lab for characterization.
I ended up being the keeper of many of those drawings. They ended up in racks in my cube, hung from clamping bars I’d tighten with a Swingline stapler! Older drawings that couldn’t be printed directly from the CAD system had to be copied using a special machine that would duplicate C- and D-size prints, which was always kind of fun as well. Over time I looked through all the company’s brochures to compile the most complete possible list of refiner types, sizes, and capacities, and doubtless I would have done that with other types of equipment as well. (I was surprised nobody had this. I expected some items to be custom for each job but probably not as many things as appeared to be.)
When I designed and sized new systems for proposals I wasn’t really doing discovery. I was only drawing and characterizing the systems that were being worked out by the senior engineers and managers for each customer through their internal discussions and external interactions with customers.
Westinghouse Nuclear Simulator Division
In this case the discovery was done by senior engineers, in concert with senior engineers from the customers’ power plants. They would sit together and highlight the equipment, pipes, connections, and instrumentation shown on the P&IDs using wide highlighter markers. Items on the drawing would be highlighted if their function was controlled by something on one of the main control room panels or if their function affected a reading on one of those panels. The main fluid and electrical components were all highlighted but most sample ports, cleanout loops, and other support equipment that was only used during outages was not highlighted. The highlighted items were then redrawn in a simplified form and given to the system modelers to guide their work. That is, the discovery was essentially complete when the individual modelers were brought into the process; the modelers were then left to do the research needed to characterize the systems they were assigned. This involved data collection, calculation, and a certain amount of interaction with the customer. That was a huge effort and I felt like I gained a career’s worth of experience doing it.
Micro Control Systems
Discovery here meant learning enough about the software system to be able to make the required changes. I also had to learn a new operating system, though that isn’t part of what I’m calling Discovery. I ended up acquiring a lot of domain knowledge of steel heating and processing (which helped me land the position at Bricmont), but that was just the raw information the populated the data structures I was modifying.
CIScorp
A lot of the discovery activities at CIScorp were kind of ad hoc but I learned more about it on one job than I did on any other before or since. The funny thing about it is that it seemed like the easiest thing in the world to do at the time, which I’m sure I owe to the experience of my senior manager and our customer liaison, who was himself either a director or VP. The project was to automate a heavily manual process of evaluating a potential customer’s employees’ health status to determine whether or not to underwrite a disability insurance policy, and if so what premium to company would need to pay. The goal was to identify every process and information flow within the department and see what could be automated.
We implemented new systems using FileNet document imaging hardware and software and the automation was achieved by scanning all received documents (of which thousands would come in from the employees’ health care providers) and performing all the collating, review, scoring, and decision-making steps using electronic copies of the documents rather than the physical paper copies that were sent in. It turned out that physically processing and moving all that paper required a lot of labor, far more than what was required to scan and index the originals and ship them off to long-term storage without needing to be highly collated.
The customer liaison walked us through every step of the existing manual process and had us talk to a handful of people in each function. There were something like eight different major functions and each of those had up to 40 employees. This was needed to handle the thousand of documents that flowed into the insurer each day. My senior manager was with us for the first week or so and then more or less left us on our own (I was the project coordinator and site rep and I had one younger analyst with me who was fresh out of college) after having imparted some wisdom about what to expect, how to interact with certain people, and how to map things out.
We actually combined the initial discovery process with some light data collection. While we were meeting people and learning the process we got estimations of how long each operation took to complete (based on limited observations and descriptions provided by individual workers) and how often various sub-operations occurred given the total number of documents processed. This information allowed us to calculate the total number of labor hours expended in every activity, and how many could be saved through automation. This was important because the first phase of that work was a competitive feasibility study to see which vendor (and toolset) would be used for the implementation. Since our company and the FileNet tools we were using won that competition (I was part of another two-person team that did something similar for a different insurance company), our company got to do the implementation as well. That involved another round of elicitation and discovery to gather the details needed to identify the data fields, business rules, user interfaces, and calculations that would be needed.
Bricmont (now Andritz)
Most of my work at Bricmont involved discovery processes that were much like those at Westinghouse, meaning that the contract defined what the system had to do, what it was connected to, and what the inputs and outputs were. Some aspects of each project were specified formally in the contract. That said, there was a certain amount of working out the details of the interfaces with other system vendors and the customer, so that was definitely discovery as opposed to data collection and characterization.
For example, the plant might have a certain convention for naming individual slabs, and that information had to be tracked from the caster (provided by a different vendor), to and through the furnace (that we provided), and to and through the rolling mill (provided by a different vendor) and points beyond (coiling and shipping, provided by other vendors). That information was also shared with the Level 1 and Level 2 systems within the furnace system and the Level 3 (and possibly Level 4) system(s) of the plantwide system.
Here’s a documented example of an interface arranged between a thin slab caster and a tunnel furnace in Monterrey, Mexico. It defines three types of messages, each of which includes a header data. The messages were specified in terms of the binary layout of the data and the messages were sent between DEC computers using the DECMessageQ protocol. The programmers also had to know how the bytes were packed on 1-, 2-, or 4-byte boundaries for debugging and testing purposes.
Caster Data
A cut at the shear at the caster end of the furnace, causes the caster level 2 computer sends telegrams to the furnace level 2 computer. These messages describe the slab data and chemistry for the piece currently entering the furnace when a tail is cut, or slab data for the piece whose head was just created, when a head is cut. The tail message is also sent when tailing out. These messages contain a header with the data. The header contains the following data:
| No. | Name | Type | Format | Length | Designation |
|---|---|---|---|---|---|
| 1 | WHO | ASCII | A7 | 7 | Sender |
| 2 | DATE | ASCII | A10 | 10 | Date |
| 3 | TIME | ASCII | A8 | 8 | Time |
| 4 | TYPE | ASCII | A1 | 1 | Telegram number |
| 5 | LEN | ASCII | A4 | 4 | Message length |
Three messages (telegrams) are associated with Caster data. They are:
| Telegram 01: | Thin Slab Report – Caster to TF, on tail cut |
| Telegram 02: | Analysis Data – Caster to TF, on tail cut |
| Telegram 03: | Thin Slab Report – Caster to TF, on head cut |
The details of the caster messages follow:
| Telegram: | 01 |
| Sender: | Caster Computer |
| Receiver: | Tunnel Furnace Computer |
| Function: | Final Thin Slab Data Report |
| Occurrence: | After each valid tail cut complete |
| Length: | 76 bytes with header, 46 bytes without header |
Data Fields :
| No. | Data/Comment | Format | Data Type | Min/Max Units |
|---|---|---|---|---|
| 1 | Slab Number | Char | C*9 | |
| 2 | Plan Number | Char | C*9 | |
| 3 | Slab Type | Char | C*1 | H,T,W |
| 4 | Grade ASCII | Char | C*7 | |
| 5 | Weight | Word | I*4 | KG |
| 6 | Width | Word | I*4 | mm |
| 7 | Thickness | Word | I*4 | mm |
| 8 | Estimated Length | Word | I*4 | mm |
| 9 | Actual Length | Word | I*4 | mm |
| Telegram: | 02 |
| Sender: | Caster Computer |
| Receiver: | Tunnel Furnace Computer |
| Function: | Analysis Data |
| Occurrence: | After each valid tail cut complete |
| Length: | 132 bytes with header, 102 bytes without header |
Data Fields:
| No. | Data/Comment | Format | Data Type | Min/Max Units |
|---|---|---|---|---|
| 1 | Slab Number | Char | C*9 | |
| 2 | Plan Number | Char | C*9 | |
| 3 | C | Word | I*4 | .001% |
| 4 | Mn | Word | I*4 | .001% |
| 5 | Si | Word | I*4 | .001% |
| 6 | P | Word | I*4 | .001% |
| 7 | S | Word | I*4 | .001% |
| 8 | Cu | Word | I*4 | .001% |
| 9 | Pb | Word | I*4 | .001% |
| 10 | V | Word | I*4 | .001% |
| 11 | Ni | Word | I*4 | .001% |
| 12 | Cr | Word | I*4 | .001% |
| 13 | Mo | Word | I*4 | .001% |
| 14 | Ti | Word | I*4 | .001% |
| 15 | Ca | Word | I*4 | ppm |
| 16 | Sn | Word | I*4 | .001% |
| 17 | As | Word | I*4 | .001% |
| 18 | Pb | Word | I*4 | .001% |
| 19 | Al | Word | I*4 | .001% |
| 20 | Al-S | Word | I*4 | .001% |
| 21 | O | Word | I*4 | ppm |
| Telegram: | 03 |
| Sender: | Caster Computer |
| Receiver: | Tunnel Furnace Computer |
| Function: | Initial Thin Slab Data Report |
| Occurrence: | After each valid head cut complete |
| Length: | 76 bytes with header, 46 bytes without header |
Data Fields :
| No. | Data/Comment | Format | Data Type | Min/Max Units |
|---|---|---|---|---|
| 1 | Slab Number | Char | C*9 | |
| 2 | Plan Number | Char | C*9 | |
| 3 | Slab Type | Char | C*1 | H,T,W |
| 4 | Grade ASCII | Char | C*7 | |
| 5 | Weight | Word | I*4 | KG |
| 6 | Width | Word | I*4 | mm |
| 7 | Thickness | Word | I*4 | mm |
| 8 | Estimated Length | Word | I*4 | mm |
| 9 | Actual Length | Word | I*4 | mm |
Please refer to the SMS Caster Computer System Duty Book, section 3.5 for additional details on these messages
American Auto-Matrix
Discovery here meant learning about the software system and communications protocols. Since I was working with the software and drivers whose functions were defined by previously defined business-driven requirements, I didn’t do much of anything in the way of discovery. Early on I took a trip with several colleagues to a customer site at a college campus in New York to learn about the problems they were having with the PC software. The distributed HVAC controllers weren’t a problem but the monitoring and configuration system had some issues.
Regal Decision Systems
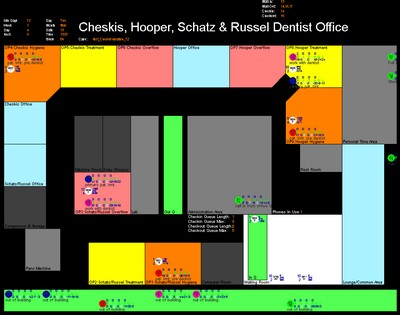
I had the chance to really develop and perfect my discovery techniques during my time at Regal. The first project they made for me (they didn’t have an actual place to put me so they created an opportunity for me, for which I am most appreciative) involved building a tool to simulate operations in dental and medical offices. The discovery I performed involved touring and mapping out the office, which included nine treatment rooms serving up to four dentists and a number of hygienists and assistants, and interviewing the dentists to learn what activities took place throughout the business. I also reviewed the appointment book to determine the number, duration, and type of procedures that were typically processed, as well as the communication with patients and insurance companies and administrative actions of various kinds. I used this knowledge to guide the subsequent data collection and characterization efforts.
The next thing I worked on was documenting the security inspection procedures for passengers and luggage at the the 31 largest airports in the US and territories, of which I was discovery lead at seven. Each visit started with a meeting of airport management that included demos of the kinds of simulations the company built and employed for analysis. We then collected drawings of each of the inspection spaces and toured each area to gather further details that drawings wouldn’t depict. The drawings provided most of the physical measurements and notes, questions, and observations were used to describe each area and its operations and rules in detail. We did further data collection at the same time by videotaping several hours of operations so we could quantify process times, diversion percentages, and arrival rates.
At the same time I also began to travel to land border crossings all over the northern and southern borders of the U.S.. These trips also involved kickoff meetings and demos with senior Customs and Immigration officers (these formerly warring departments have since been merged, along with supporting functions, into the combined Customs and Border Protection Agency, which is part of Homeland Security) and continued with tours of the port facilities. We learned what facilities and operations took place at each location, the kind of traffic served (private vehicles, commercial vehicles, buses, and pedestrians; some ports also process rail traffic, but I never collected data on those). The initial discovery efforts guided subsequent data collection and process characterization activities.
The company eventually built tools to model the port activities on the Canadian and Mexican sides of the border as well (plus operations on southern Mexico; I visited a crossing on the Guatemala border), and their processes were very different than those employed on the U.S. side. I was the lead discovery agent and wrote all the documentation that would be used to build the modeling tools and guide data collection efforts. We started by traveling to Ottawa and Mexico City to meet with representatives from the major agencies that had a presence at their respective port facilities to learn what their concerns were, what they might have wanted to learn from simulation analyses we performed. We then started touring representative large ports, first to discover the specific activities that took place at each, and later to perform combined discovery and data collection efforts. I ultimately visited twenty three different facilities in person and analyzed that many more in detail.
Another major effort undertaken during my time at Regal involved building evacuations, and we built tools to simulate a wide variety of buildings and ground areas (e.g., the National Mall during mass participation events like 4th of July fireworks) for several different applications and four major customers. I helped do the elicitation of business needs and capabilities, did in-person tours to gather details not shown in floor plan and other drawings we collected, and negotiated interfaces (data items, layouts, and communication protocols) with partner vendors. I did a lot of design, documentation, UI wireframing, coding, and analysis for all these projects.
I took part in similar activities for a few additional efforts of smaller scope around also taking over a program management slot for some Navy support contracts. That involved discovery of an entirely different kind! That aside, I learned a lot about first responder operations, and the National Incident Management System (NIMS), and a few interesting pieces of related technology.
RTR Technologies
Since RTR had split off from Regal and served largely the same customers, I was able to leverage a lot of my existing subject matter expertise and domain knowledge. Although we did a lot of work related to border operations I never traveled to or analyzed operations in detail at any individual port. Instead, I learned about how data is collected and processed behind the scenes nationally and how headquarters processes it to determine and justify the staff (and funding) needed to support the operations CBP is charged with carrying out. These discovery efforts involved interviews with a lot of managers, engineers, and analysts in DC as well as reverse engineering existing staffing models and learning the process by which each year’s estimates were put together.
The other major activity, which took up the majority of my time, was supporting an ongoing program that maintained and employed a large, complex simulation of aircraft maintenance and support logistics. A lot of the discovery for me involved learning the software and its operations, the relevant data sources, the rules governing maintenance operations, and the needs of the different analysis efforts. Discovery also involved learning details of many different aircraft.
The final effort I supported, and ultimately marshaled to a close, was a third-party (independent) VV&A of a software tool used by the Navy and Marine Corps to manage fleets of aircraft over their deployment and service life. Discovery in this case included learning the details of the software itself but more importantly the methodology we needed to employ to conduct the independent verification and validation effort of the two major software modules.
Conclusion
Discovery mostly involves learning about the process you are trying to create, model, automate, or improve. This is done using interviews, observation, document review, and other means. I classify learning about internal and external customer needs to be something different; I tend to call that Intended Use Definition. However, the processes often overlap and are conducted iteratively.