There are a couple of ways to represent the flow of data in any existing or proposed system. One is by creating a flow diagram using any notation you prefer that communicates the necessary understanding to all participants. I have done this a number of ways, as I will describe below. The other way, and the one described in the BABOK (and thus what will need to be understood to pass any of the IIBA’s relevant certification exams), is to use a formal methodology like Yourdon DeMarco, Gane & Sarson, SSADM, or Yourdon and Coad.
Those formal methods are described in many places, with this webpage giving a particularly good overview. The formal methods all include the same four components, which are external entities, processes, data stores, and data flows. One major limitation not mentioned by the BABOK, or hinted at indirectly, is that the formal methods don’t show specific operations, timing, loops, or other logic. They just provide a static overview of what things can flow from where to where.
As an industry there had to be a place to start, but I find these notations to be almost wholly unsatisfying. There is sooo much more information which can be shown, which could greatly enhance the understanding of all participants.
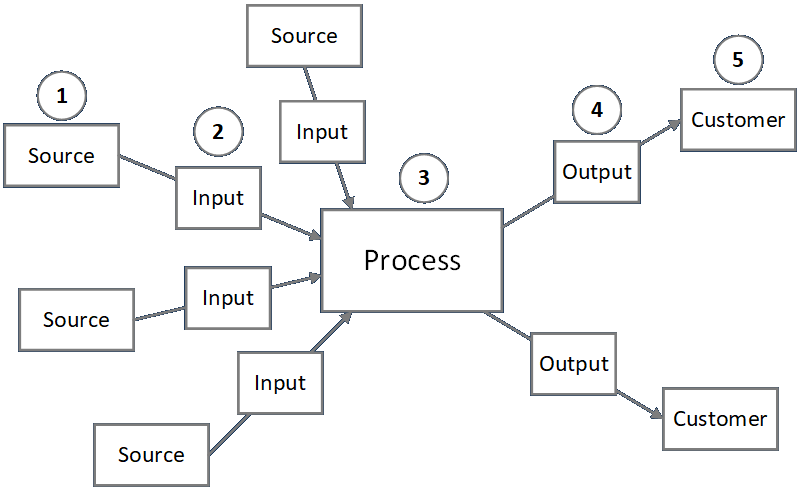
The first thing to understand is that both formal and ad hoc methods call upon the analyst to consider everything from a S-I-P-O-C (or C-O-P-I-S) point of view. This helps the analyst identify the source of input data into and the destination of output data from every process.
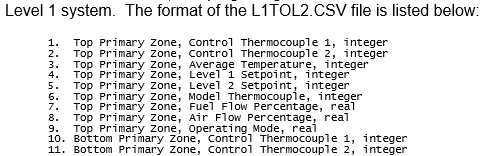
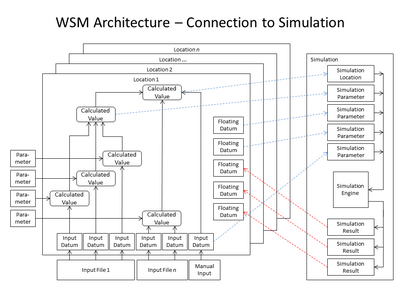
The formal methods give no indication of the contents of the data items transferred hither and thither, but those can be documented in endless ways. For example, some information can be included on the drawings (as shown in the drawing directly below), and detailed descriptions of the structure and meaning of data items (or collections thereof) can be included in other kinds of written documentation.
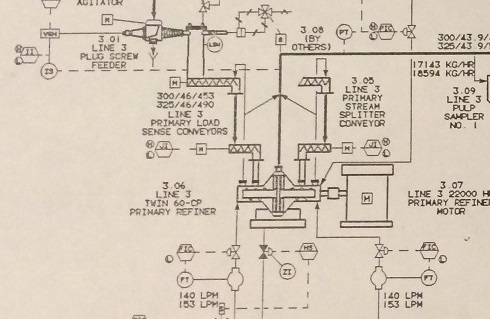
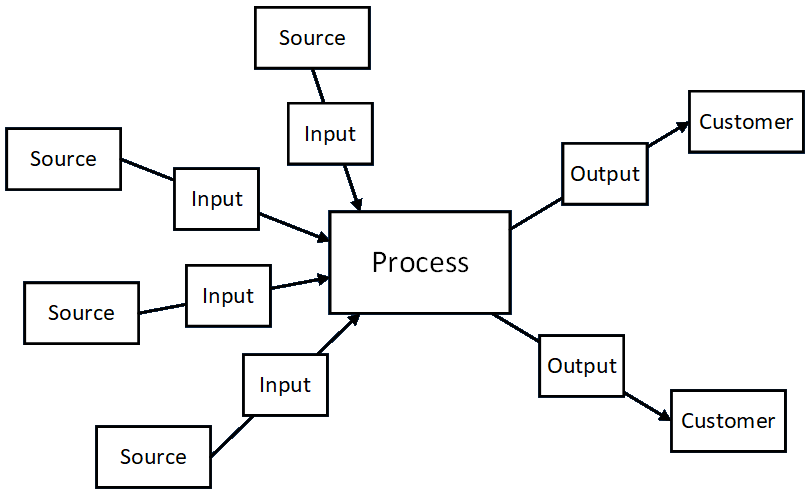
Ad hoc drawings can include data flows in conjunction with movements of other, typically physical, entities. In this case the analyst might show the movement of physical entities with solid lines and data items with dashed lines. Additionally, indications of business functions and departments, IT infrastructure items, and human participants can all be included on drawings, as long as the meaning and context are clear and well understood.
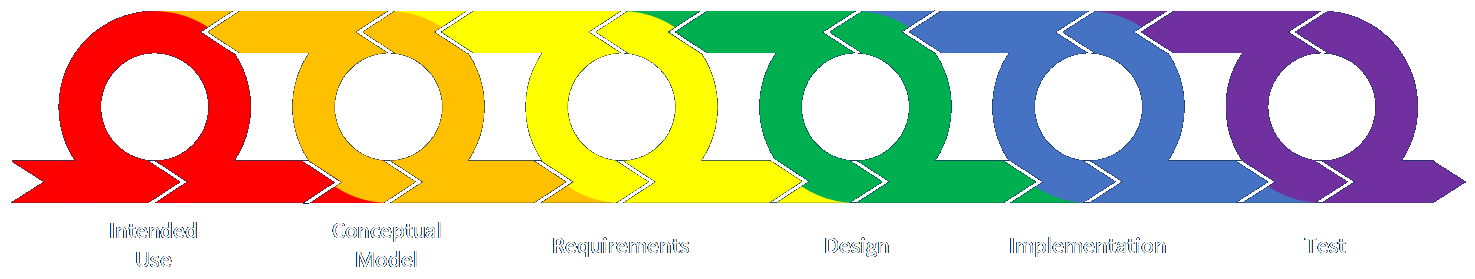
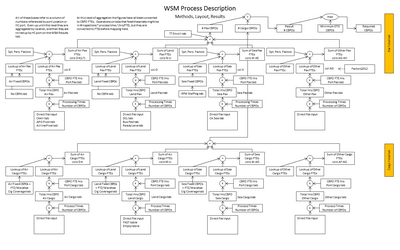
A lot of other information about control flow, logic, and the nature of specific calculations can be included as well, as in the following handful of examples. The first includes logic and decisions, the second the same plus human users interacting with the system in many places (which itself could bear a great deal of additional description), the third includes a lot of architectural elements, and the fourth shows how some calculations are carried out.
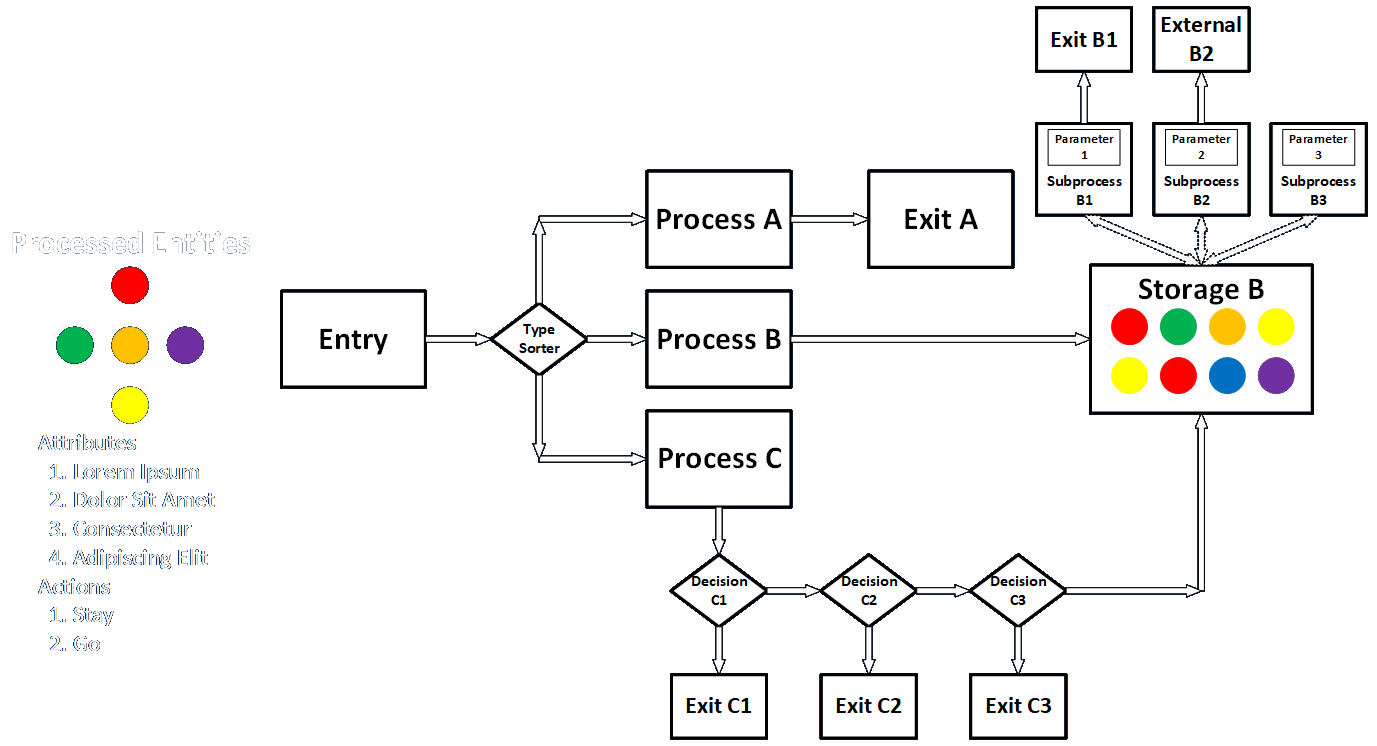
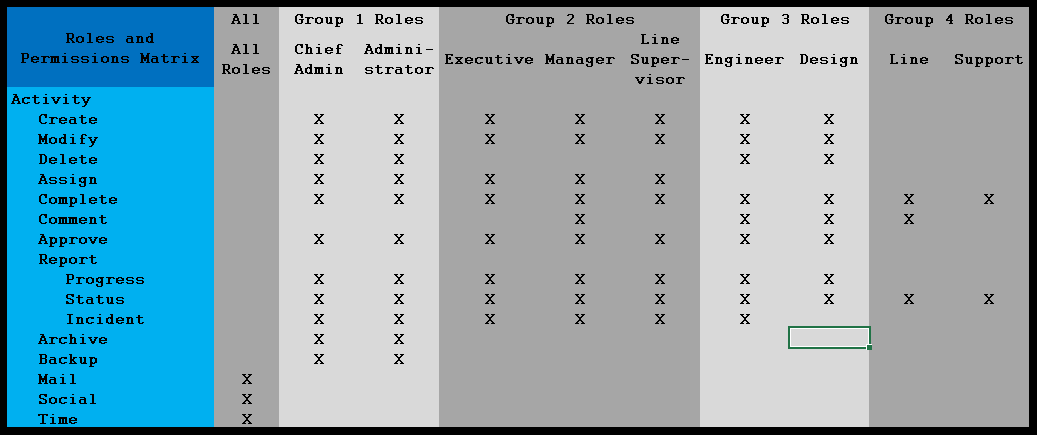
Diagrams can describe different kinds of entities and messages, logic, decisions, storages, and other elements in any way analysts and customers can understand.
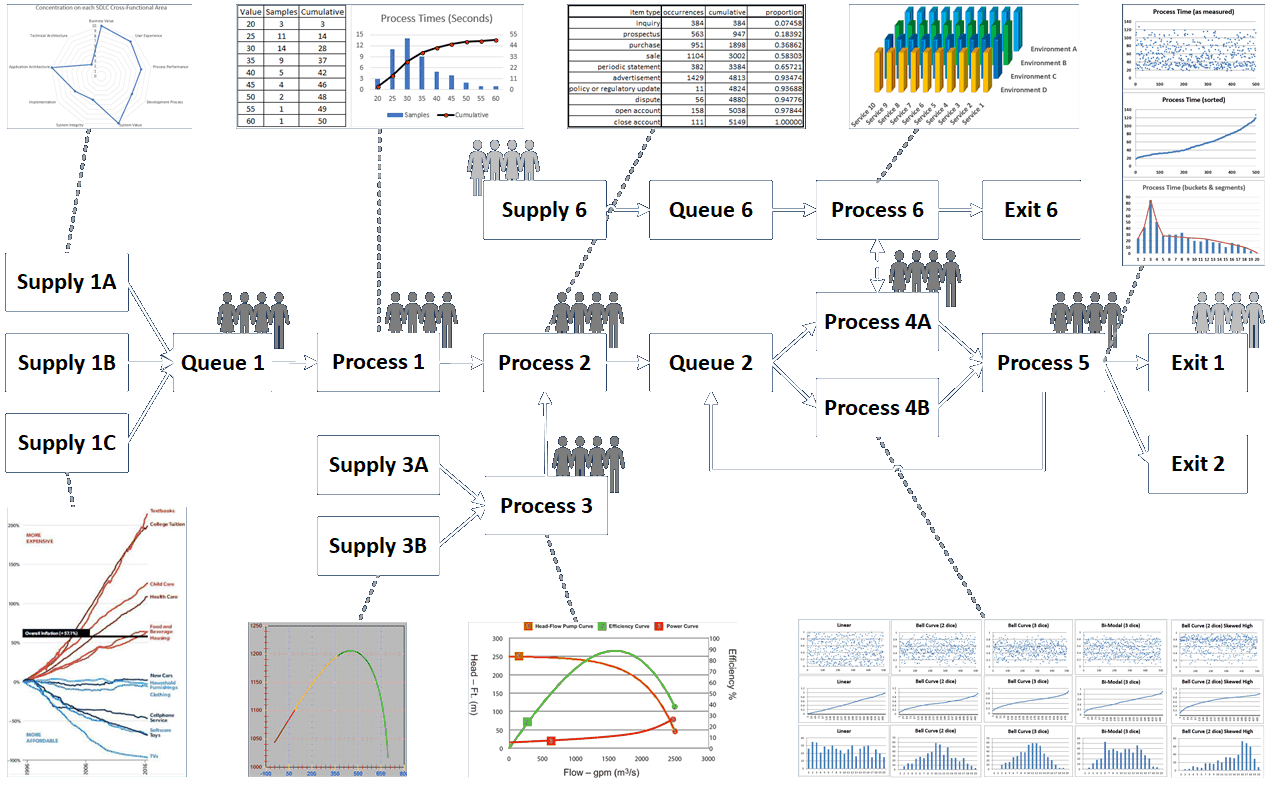
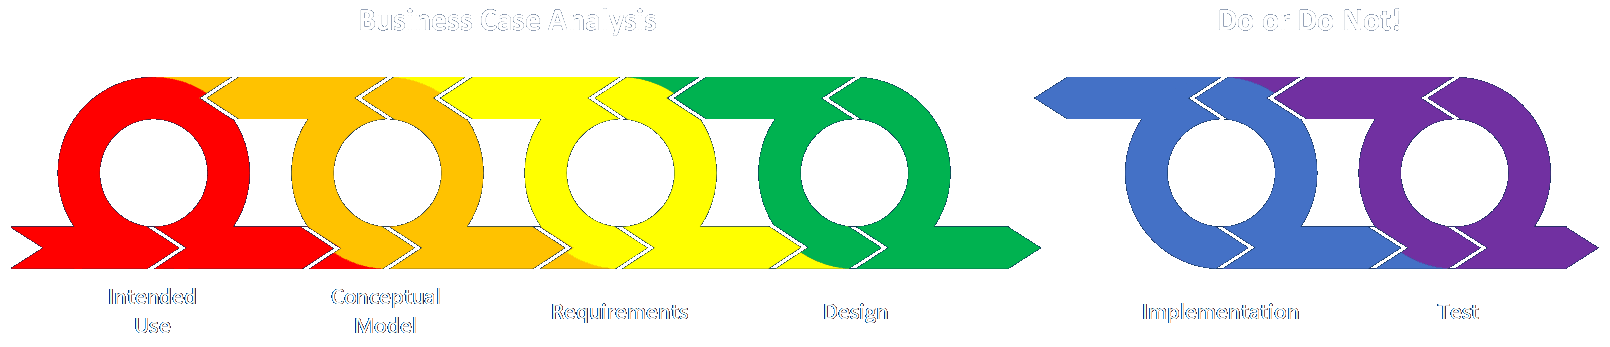
Diagrams can show data associated with different processes in many ways, and can also show where people interact with the system.
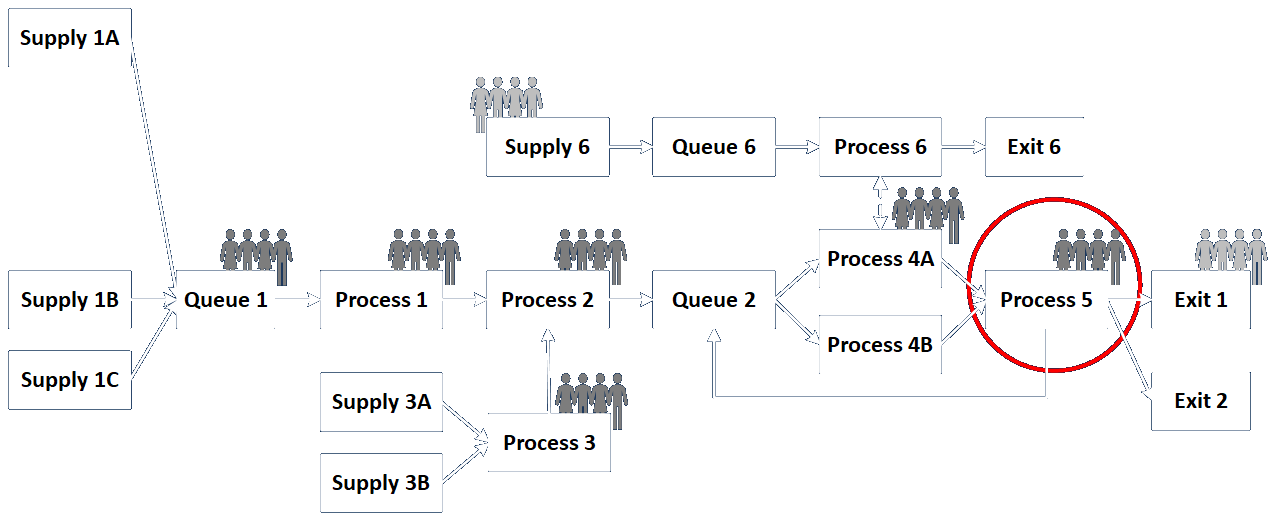
Diagrams can show how data are logically organized and processed in many different ways and in many different contexts.
This diagram provides a different and more detailed view of the same system described in the diagram directly above. Use your creativity!
I discuss a wide variety of inter-process communication methods here. Each one involves sending a package of data from one process to another. Sometimes the processes are within the same program, sometimes they are in different programs running on the same machine, sometimes they are on different machines on the same network, and sometimes they are on different machines on different networks. What they all have in common is that they all require both physical and data protocols to ensure the communication is completed successfully. I discuss one aspect of this here.
Again, be sure you understand the formal methods defined in the BABOK when it is appropriate to do so, but feel free to represent storages and flows of data as you see fit in other situations. The best way to judge whether a given representation is appropriate or allowed is whether or not it builds clear, shared understanding, and results in the creation of an effective solution.