Use cases may be thought of as packages of instructions or actions taken by an actor when interacting with a system. The actor does not have to be human, and the system does not have to involve computers or IT. That said, since use case analysis arises from UML, which itself comes out of systems analysis and it’s kissing cousin software engineering, it will not be uncommon to see this technique used in the design of software.
Let us consider an individual pulling into a gas station. The person may want to buy snacks, use the restroom, or purchase gas. Use cases provide a way to represent those activities.
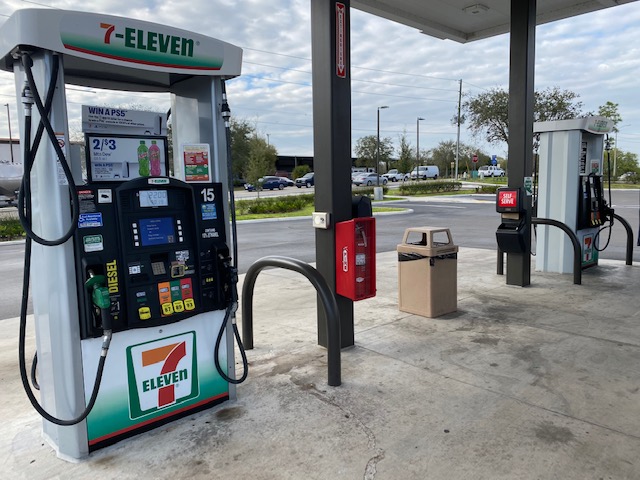
We know the customer wants to purchase gas, and we also know the customer has to pay for the gas and then pump the gas. Each activity can be made up of many different steps, and these can have alternative paths, including error paths.
The following is an example of a use case. Many references, including the BABOK, will show human actors as stick figures. For some reason, which probably involves an affront to motherhood and small fuzzy kittens, Visio chooses not include a stick figure as a native drawing element.
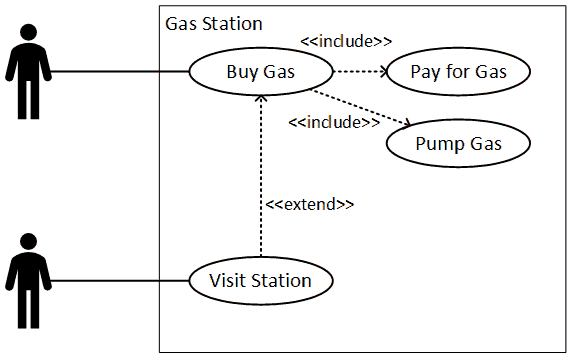
A use case diagram will have some standard components.
- Name: The name of the activity undertaken by the actor (generally involves a verb). For this example, let’s look at the item titles “Bug Gas.”
- Goal: Desired end state of the activity. In this example the goal is to have added a certain amount of gas to the car’s gas tank.
- Actor: Entity (human or otherwise) that initiates the action in pursuit of the goal. Here the customer is a person who arrived with the car.
- Preconditions: Any aspect of the system or environment that must be true in order for the action to begin. Some possible examples are that the gas pump is working, there is gas in the underground storage tank that can be pumped, and that communications with the payment processor are working.
- Trigger: Even that begins the flow of actions. The actor may initiate the process presenting a payment card to the pump, which will make it ready to dispense gas. Alternatively, the actor may go to an inside teller and arrange payment there, which will activate the pump.
- Flow of Events: The sequence of steps or occurrences undertaken by the actor and system to achieve the desired goal. You can imagine long sequences of events involved with completing payment and actually putting gas into a receptacle.
- Post-conditions or Guarantees: Any aspect of the system or environment that must be true when the activity is complete. In this example, the gas will be dispensed, a receipt will be offered, and the pump will reset to a non-enabled state. Additional effects are possible.
Some of these items are made clear by looking at the diagram, but others are not. This is one of many reasons why I have never used them, even though I have described, designed, implemented, and tested these items in numerous ways.
The flow of events can be represented as a flowchart with as many branches as endpoints as are needed. It can also be written out as a list of text items or in any other way that provides clarity and understanding.
Use case diagrams include two other bits of nomenclature which are useful. These involve the concepts of including and extending actions or groups of actions.
The include relationship seems more understandable. It allows individual sub-actions to be bundled up and reused so they do not have to be repeated. For example, many individuals may service a vending machine, and each may undertake a wide variety of actions. However, they each will have to open the machine at the beginning of the process, and then close the machine at the end. So if we create separate use cases for the open and close activities we can have nice little package of activities that can be reused. That said, a weakness of this technique is that the timing is not necessarily clear.
I’m not entirely sure I have a complete grasp on the extend concept. I believe is it intended to show that other, complete and self-contained packages of actions can be added to an activity. So, if you are going to buy gas, you absolutely must pay for the gas and pump the gas. However, if you visit a gas station, you may do a lot of different things. One of those may involve buying gas, but that isn’t necessarily required. I’m actually not even sure I’ve drawn the arrow in the correct direction.
While this technique isn’t my favorite, it is a standard part of the UML oeuvre and a lot of people do use it.