
Imagine a network with the following representative elements. Many external and internal workstations, mobile devices, and pieces of equipment exchange information with an internal system of servers and capabilities.
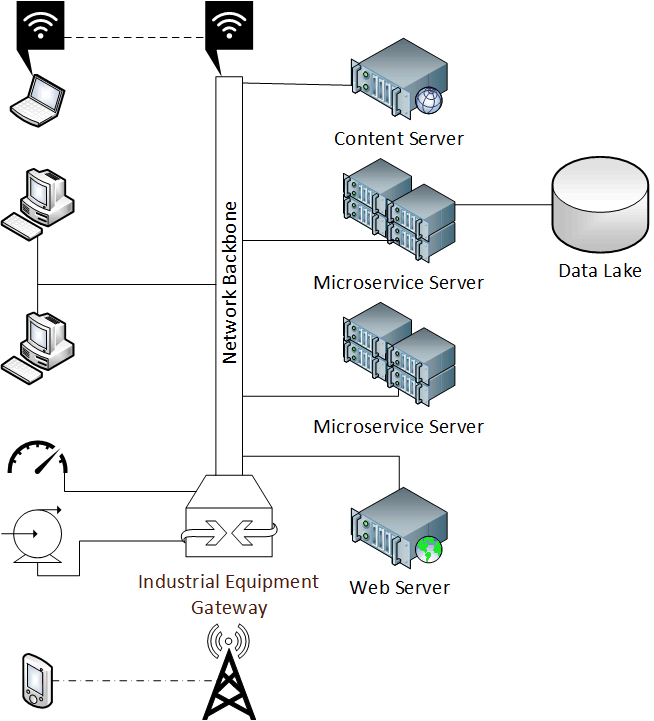
Now imagine that some of the internal servers provide a number of services where sending them a message results in them returning a package of information that can be made use of, while simultaneously causing some kind of (desirable) internal side-effect, such as a new or modified entry in a data table. This kind of distributed, stateless architecture is called a microservice, and they are usually bundled to provide groups of small, related functions that cause a related set of desirable side-effects.
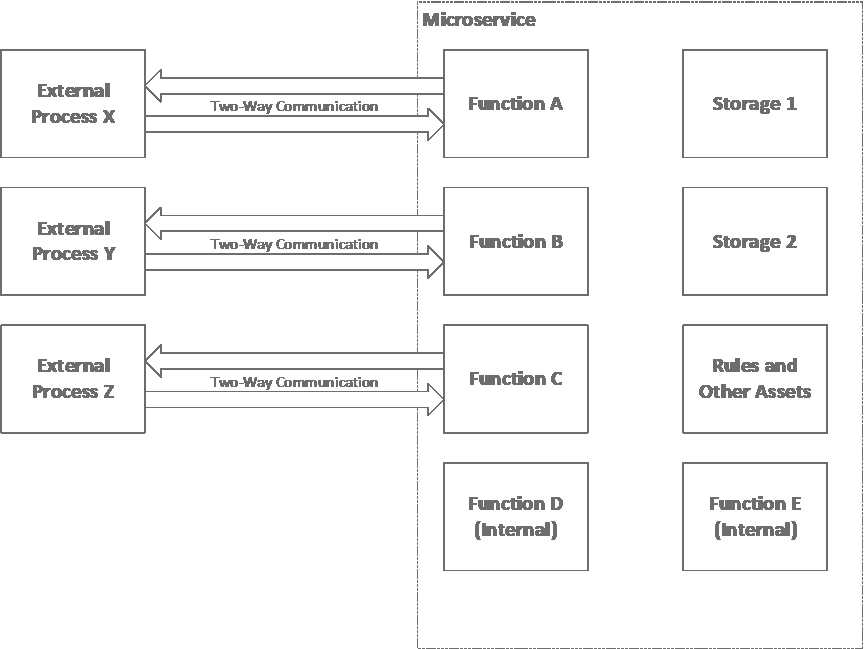
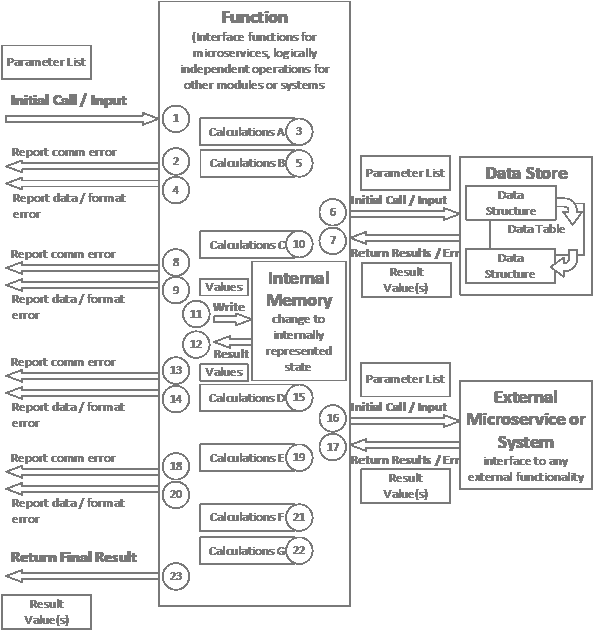
Now imagine a group of external applications that make a series of calls to a given server, to evoke a series of related actions, in a system like that depicted in this block architecture diagram.
Given these description, now ask what is known about the order in which these operations usually take place.
The answer shouldn’t be, “not much,” even if you had published descriptions of the information and format of the messages sent and the answers received.
The answer should be, “nothing.”
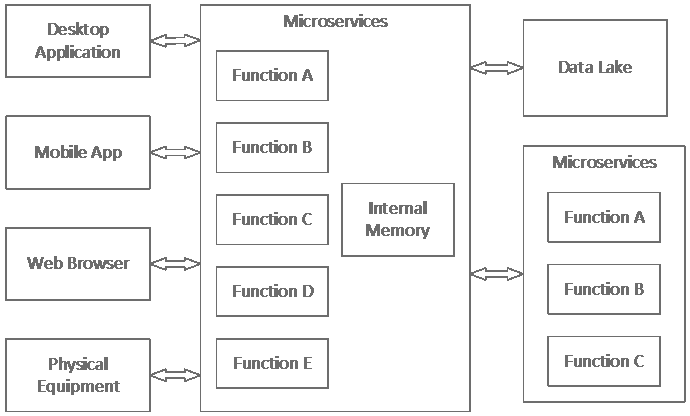
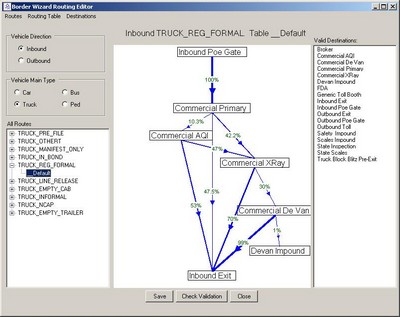
There are a lot of ways the order of operations could be listed. They could be written out as a series of instructions in a document or a use case. The order could be left undocumented so the various capabilities could be used as seems appropriate for each application. Or, customized ad hoc representations could be made up as shown in the next figures. The first shows a routing diagram that implies timing, while the second shows an order of operations overlaid on a block architecture diagram.
However, there is a fairly standard way these can depicted, and that is by creating a sequence diagram, an example of which is shown next. These grew out of the Unified Modeling Language (UML) practice that developed within systems engineering. It is often, but not exclusively, used in computer science, and I refer to it in various of my presentations.
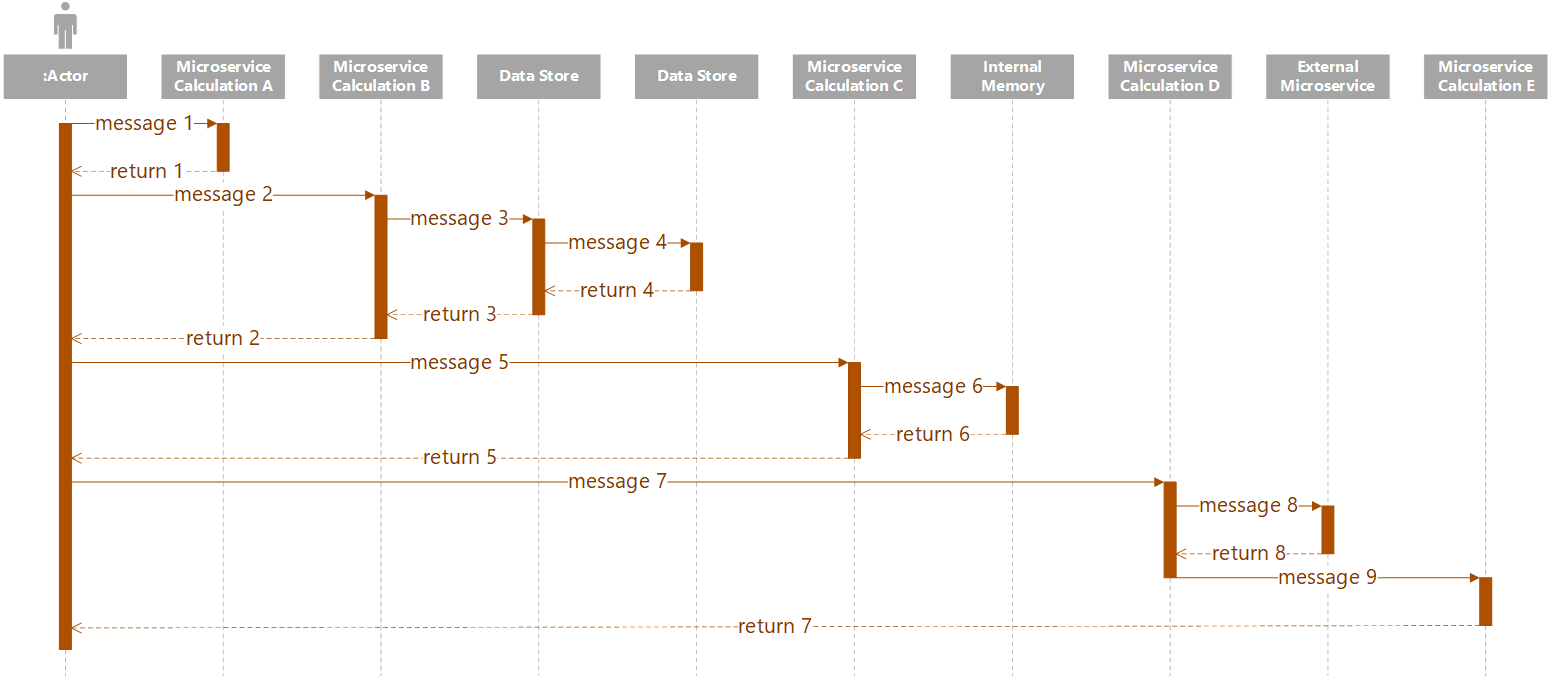
These diagrams show operations in time from top to bottom, and also show different components from right to left that house operations. Each object is represented by a lifeline, which is shown as a dashed line that descends from an object box, examples of which are shown in gray along the top. An “X” on an object’s lifeline, placed just below the last activation box, indicates that the object goes out of existence (or is otherwise deallocated or destroyed). Activation boxes are shown in brown (note that any colors can be used for any elements), and show the span of time during which the item is acting with respect to the process depicted. They extend vertically along the lifeline. The top of the box shows when the object becomes active, and the bottom of the box shows when the object becomes inactive. If an object is called upon to act more than once, multiple activation boxes can be placed along a single lifeline.
Control is passed to different objects by passing messages. In most cases, as in microservice architectures, messages are actually passed using some kind of communication channel, but many means of passing control are possible. For example, a function call may have parameters and may result in values being returned, but they may both be in a single unit of code that doesn’t involve any kind of “over-the-wire” communications.
Note that two kinds of messages can be passed. Synchronous messages are shown with filled-in arrows (like those in the figure above), and represent operations where the sender may not carry out any operations until a return message is received (or a local time-out procedure is potentially invoked). Return messages are shown as dashed lines and with open arrows. Messages can all contain information of various kinds and in any quantity. The simplest messages will indicate requests and acknowledgements with no other information. Asynchronous messages are shown with open arrows and indicate that the sender may perform other operations while waiting for a reply (or that a reply may not even be expected or needed).
The BABOK shows only the most basic elements of a sequence diagram, but many more can be used. There are methods for depicting logical branches, self messages, recursion, and more, and you are invited to research other sources for more information.