Business Capability Analysis

Business capability analysis is the process of evaluating a many aspects of a business’s ability to accomplish defined goals and support and develop its staff and customers. It seeks to create a consistent rubric for conducting repeatable analyses that allow participants to compare businesses, analyze strengths and weaknesses, and identify and effect improvements.

The analysis process involves the creation of capability maps. The figure below shows what the relevant areas of evaluation are and how they might be scored.
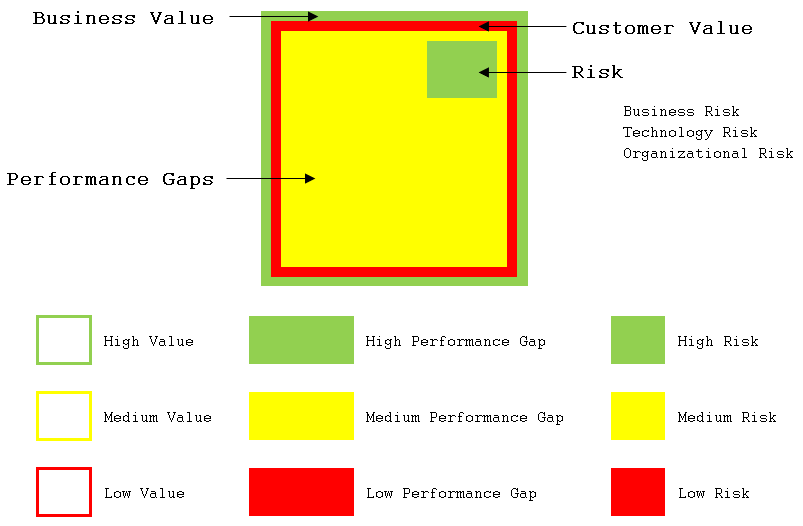
The figure illustrates that the analysis involves value to the customer and to the business, identified performance gaps, and different kinds of risks. Since there are so many possible considerations to analyze, as will become apparent, the technique keeps the scoring simple. There’s not much point in trying to define the difference between a six and a seven on some arbitrary scale (much less a 67 versus a 73), so high, medium, and low is more than sufficient to guide effort to obvious areas of improvement.

Risk can be analyzed with respect to the business (its market functions, reputation, relationships, and financial status), technology, the organization (its people, environment, and function), and the market (the overall state of that industry or segment). See further discussions of risk here.

An organization’s capabilities can be identified and examined based on any breakdown of operations and capabilities. They should be relevant to what the organization does and places emphasis on. When comparing organizations, it’s a good idea to do so using comparable hierarchical breakdowns.

The BABOK’s examples provide some solid guidance in this regard. It identifies major areas of inquiry including the organization, the ability to conduct project analysis, professional development, and the quality and structure of management. Those areas can all be broken down into sub-considerations. Under organizational analysis, we might consider capability analysis, root cause analysis, process analysis, stakeholder analysis, and roadmap construction. Note that these examples are all rather BABOK-y, which is fine, but do not feel bound by these specific areas of examination. Use ones that work for your specific situation. While it’s always good to be able to have an internal analysis capability, and the BABOK provides a great roadmap for it, sometimes you need to be more specific. If you run a distribution business, for example, you might examine your tracking, scheduling, routing, and dispatching capabilities.

Finally, you can create grids that show all the high-level areas of inquiry on one axis and their sub-areas on another, so a high-level overview of a wide variety of activities can be had at a glance. Some patterns may be obvious, and sometimes you might just want to address individual pain points.

I say quite often that I have never used the technique, though it strikes me as being valid and I can clearly see the utility. I have done the equivalent analyses in a lot of different ways. Like many of the fifty BABOK techniques, it’s a place to start, an organized and consistent way of doing something. It may or may not be the right way for you to approach any particular analysis, but it’s good to be aware of it. Someone thought enough of it to create it and find it and derive value, and it might turn out to be the exact thing you need!

Finally, note that you should not be bound by drawing out the situation for each major and sub-area of concern as shown in the figure above. Use any method of expression that works. You can just as easily create a spreadsheet or table that shows the relevant scores in different grid boxes (an X or solid shading in the relevant H/M/L column), by letter (H, M, or L) or word (High, Medium, or Low). Any of those can be color coded. Use what works for you and in any way your customers and colleagues can understand.

Posted in Tools and methods | Tagged , , | Leave a comment

TWSL Series 15: Why Use Business Analysts and Their Techniques?

Today I gave this webinar for the Tom Woods School of Life Lunch and Learn Series. The slides are here.

Posted in Tools and methods | Tagged , , , | Leave a comment

TWSL Tech Series 02: Three.JS and WebGL

Today I gave this webinar for the Tom Woods School of Life Lunch and Learn Series. The slides are here.

Posted in Software | Tagged , , , , | Leave a comment

TWSL Series 14: Business Analysis Techniques from the BABOK

Today I gave this webinar for the Tom Woods School of Life Lunch and Learn Series. The slides are here.

Posted in Tools and methods | Tagged , , , , | Leave a comment

TWSL Series 13: Artifacts Needed to Understand the Full Story

Today I gave this webinar for the Tom Woods School of Life Lunch and Learn Series. The slides are here.

Posted in Tools and methods | Tagged , , | Leave a comment

Organizational Modeling

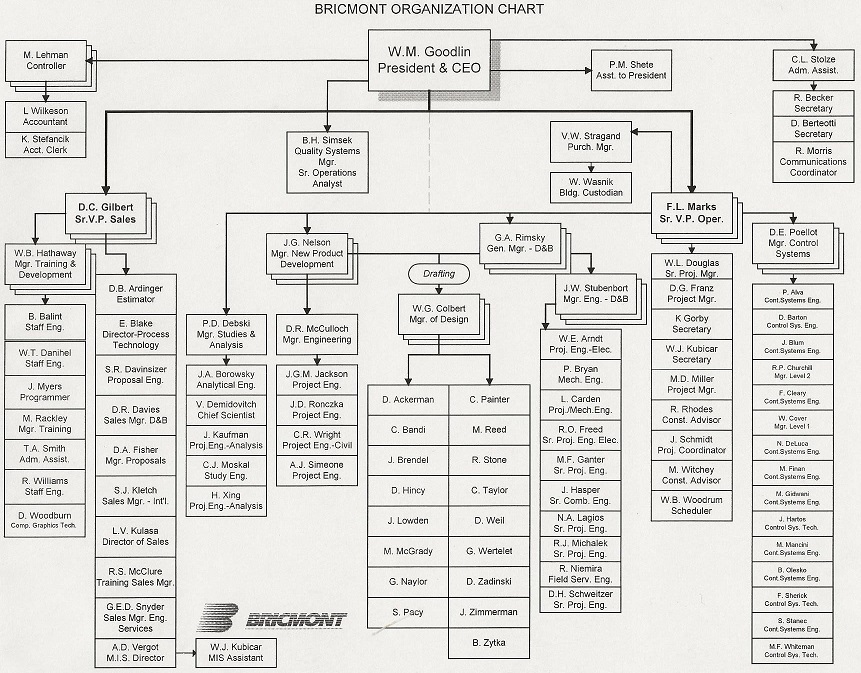
Organizational modeling is a technique for representing the functional, operational, or physical structure of cohesive groups of people. The most common way of doing this is by using organizational charts or “org charts.” The traditional way these are shown is as some kind of hierarchy, but other methods of representation are possible.

One of the big issues when organizing a hierarchical structure is defining a taxonomy, and that involves making decisions on which kinds of divisions will take precedence. I touched on an aspect of this when I discussed my attempt to classify all my Lego pieces when I was about fourteen. The major ways hierarchies can be defined are by function, product line, type of customer served, and the like. These all prioritize on similar criteria but in a different order.

The chart above includes a lot of standard elements. I worked for this company from 1994 to 2000 and had a fabulous time (but also got very burned out). The main hierarchy is based on a president and two VPs, a bunch of departments and layers of managers arranged under them (occasionally sharing functions like drafting), and special functional groups and individuals attached and reporting where needed.

The other major way organizations might be models is in matrix format. In this case, different entities will report to two different types of managers, each with different concerns and responsibilities. For example, one axis of control (think of items in the rows of a grid) might be concerned with different product lines, while the other axis of control (the columns in a grid) might concern itself with different job functions needed to make up teams. Another possible axis can be defined for specific projects and programs. This is always a trick to get right, and the problem of responsibilities without authority often arises.

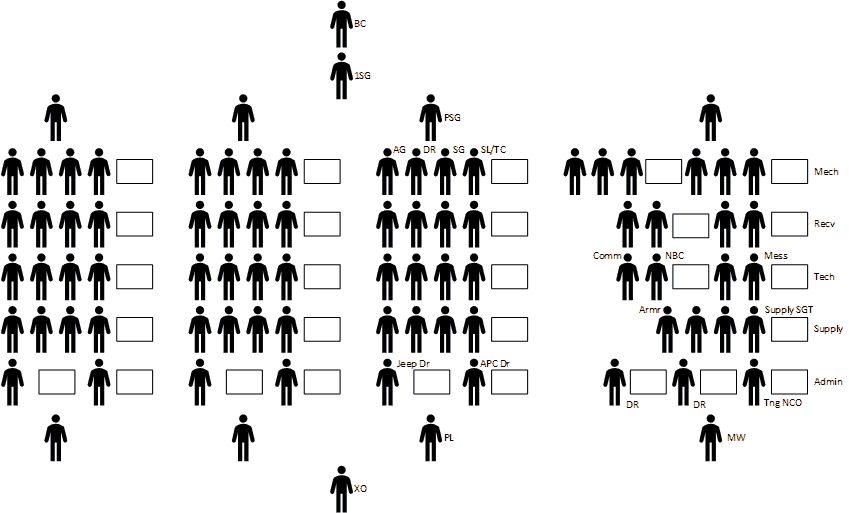
The representation below is of the type of air defense artillery unit I used to work for. I served in several different positions during my time in the service and learned a lot from each one. I’ve included a rough representation of vehicles in the unit, but as I think about it I’m certain I’m leaving some out of the representation for the headquarters platoon to the right. The three platoons to the left all included four self-propelled Vulcan air defense cannons (long since retired), an APC from which the platoon leader commanded the platoon, and a jeep for the platoon sergeant. There are actually standard symbols for representing different kinds of military entities, one of which is linked here.

Organizational charts can be as varied and complex as you’d like, and a decent amount of humor can be associated with this idea. Try an image search on the internet using the words funny org charts to see some clever examples.

What most organizational models have in common are the following elements.

  • Model type: functional or matrix as described above
  • Roles: titles and duties with different people and groups hold and perform
  • Interfaces: connections between groups and entities along which information and materials can be exchanged
  • Charts: boxes show entities and groups, lines show reporting and other relationships
  • Influencers: formal and informal sources of information, power, and sway within the organization
Posted in Tools and methods | Tagged , , | Leave a comment

TWSL Series 12: Management Observations and Agile Deep Dive

Today I gave this webinar for the Tom Woods School of Life Lunch and Learn Series. The slides are here.

Posted in Management | Tagged , , , , , , | Leave a comment

SWOT Analysis

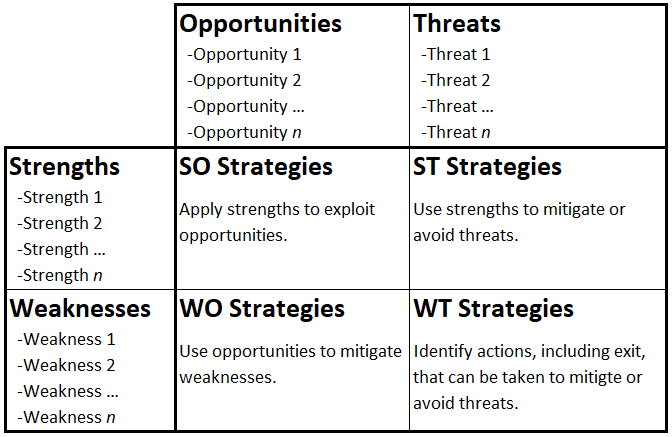
SWOT is an acronym for Strengths, Weaknesses, Opportunities, and Threats. The basic idea of this analysis is straightforward, but the decisions and actions can be as complex as can be imagined.

Much like the Important vs. Urgent grid, this technique involves identifying items in two opposing pairs, and then analyzing them in a grid as shown. It is generally performed to assess the state of an organizations readiness from multiple points of view. It may be thought of as an organized way of taking stock and preparing for the future. It may be applied to any time scale and across part of all of an organization, ranging from individuals to projects to departments to divisions to the entire organization.

Strengths are things an entity or capability does well and tends to support successful outcomes. They are contrasted with weaknesses, which are things an entity does less than well or does not do at all.

Opportunities are elements in the eternal environment that may be exploited for gain or success. These may include new technologies, mistakes by competitors, general economic tailwinds, and other factors. Threats, by contrast, are factor that pose challenges to the organization. They may include new strengths realized by competitors, new technologies, general economic headwinds, regulatory changes, and so on.

Care should be taken to ensure the analysis is thorough on the one hand, but targeted to the situation of concern on the other. Additionally, some elements will be obvious, especially with respect to opportunities and threats, while others may be more subtle or diffuse. Brainstorming lists of strengths and weaknesses can be a useful approach but again, make sure they are applicable.

Upon performing an analysis in any quadrant, the organization or entity can make plans to develop new technologies, advance proposals, team with other entities, purchase supplies, set aside extra finds, purchase or modify insurance, enter or exit markets, modify dividends, offer or repurchase equity or bonds, open or close locations, acquire other organizations or sell out to others, and so on. The possibilities are endless.

One unexpected form I’ve seen this take is a capability analysis performed by one of my former employers. They surveyed all the employees to list the skills they had and the types of analyses they could do, and the senior managers tried to identify opportunities they could go after by leveraging those capabilities. In the parlance of a SWOT analysis, this was an example of an SO strategy.

Posted in Tools and methods | Tagged , , , | Leave a comment

TWSL Series 11: BA Overlaps with Other Practice Areas

Today I gave this webinar for the Tom Woods School of Life Lunch and Learn Series. The slides are here.

Posted in Tools and methods | Tagged , , , , , , , , , , , , | Leave a comment

Use Cases and Scenarios

Use cases may be thought of as packages of instructions or actions taken by an actor when interacting with a system. The actor does not have to be human, and the system does not have to involve computers or IT. That said, since use case analysis arises from UML, which itself comes out of systems analysis and it’s kissing cousin software engineering, it will not be uncommon to see this technique used in the design of software.

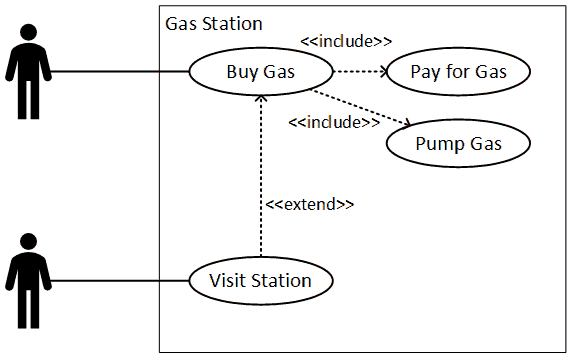
Let us consider an individual pulling into a gas station. The person may want to buy snacks, use the restroom, or purchase gas. Use cases provide a way to represent those activities.

We know the customer wants to purchase gas, and we also know the customer has to pay for the gas and then pump the gas. Each activity can be made up of many different steps, and these can have alternative paths, including error paths.

The following is an example of a use case. Many references, including the BABOK, will show human actors as stick figures. For some reason, which probably involves an affront to motherhood and small fuzzy kittens, Visio chooses not include a stick figure as a native drawing element.

A use case diagram will have some standard components.

  • Name: The name of the activity undertaken by the actor (generally involves a verb). For this example, let’s look at the item titles “Bug Gas.”
  • Goal: Desired end state of the activity. In this example the goal is to have added a certain amount of gas to the car’s gas tank.
  • Actor: Entity (human or otherwise) that initiates the action in pursuit of the goal. Here the customer is a person who arrived with the car.
  • Preconditions: Any aspect of the system or environment that must be true in order for the action to begin. Some possible examples are that the gas pump is working, there is gas in the underground storage tank that can be pumped, and that communications with the payment processor are working.
  • Trigger: Even that begins the flow of actions. The actor may initiate the process presenting a payment card to the pump, which will make it ready to dispense gas. Alternatively, the actor may go to an inside teller and arrange payment there, which will activate the pump.
  • Flow of Events: The sequence of steps or occurrences undertaken by the actor and system to achieve the desired goal. You can imagine long sequences of events involved with completing payment and actually putting gas into a receptacle.
  • Post-conditions or Guarantees: Any aspect of the system or environment that must be true when the activity is complete. In this example, the gas will be dispensed, a receipt will be offered, and the pump will reset to a non-enabled state. Additional effects are possible.

Some of these items are made clear by looking at the diagram, but others are not. This is one of many reasons why I have never used them, even though I have described, designed, implemented, and tested these items in numerous ways.

The flow of events can be represented as a flowchart with as many branches as endpoints as are needed. It can also be written out as a list of text items or in any other way that provides clarity and understanding.

Use case diagrams include two other bits of nomenclature which are useful. These involve the concepts of including and extending actions or groups of actions.

The include relationship seems more understandable. It allows individual sub-actions to be bundled up and reused so they do not have to be repeated. For example, many individuals may service a vending machine, and each may undertake a wide variety of actions. However, they each will have to open the machine at the beginning of the process, and then close the machine at the end. So if we create separate use cases for the open and close activities we can have nice little package of activities that can be reused. That said, a weakness of this technique is that the timing is not necessarily clear.

I’m not entirely sure I have a complete grasp on the extend concept. I believe is it intended to show that other, complete and self-contained packages of actions can be added to an activity. So, if you are going to buy gas, you absolutely must pay for the gas and pump the gas. However, if you visit a gas station, you may do a lot of different things. One of those may involve buying gas, but that isn’t necessarily required. I’m actually not even sure I’ve drawn the arrow in the correct direction.

While this technique isn’t my favorite, it is a standard part of the UML oeuvre and a lot of people do use it.

Posted in Tools and methods | Tagged , , | Leave a comment