Business Rules Analysis

Business rules are procedures, decisions, and parameters that govern business operations. They are always under control of the business. (This is true even when imposed by external regulations. The business controls some aspects of how those rules are followed.)

Business rules analysis involves defining, validating, and organizing business rules. Business rules can describe the actions taken, the decisions made, and the criteria that govern those decisions.

Like requirements, business rules must be expressed in a succinct, declarative, unambiguous way, that allows them to be understood, implemented, and executed in a way that can readily be judged. They should be expressed using appropriate terms of art (see discussion of a glossary here). Rules should be expressed separately from how they will be enforced. For example, a rule might state that for all orders reaching sixty days from fulfillment without having been paid, will result in a message being sent to the account holder. That describes the rule, but doesn’t say anything about the mechanisms that might be instituted to complete the various actions needed to follow it. There are many ways to express business rules, and multiple rules can be chained together.
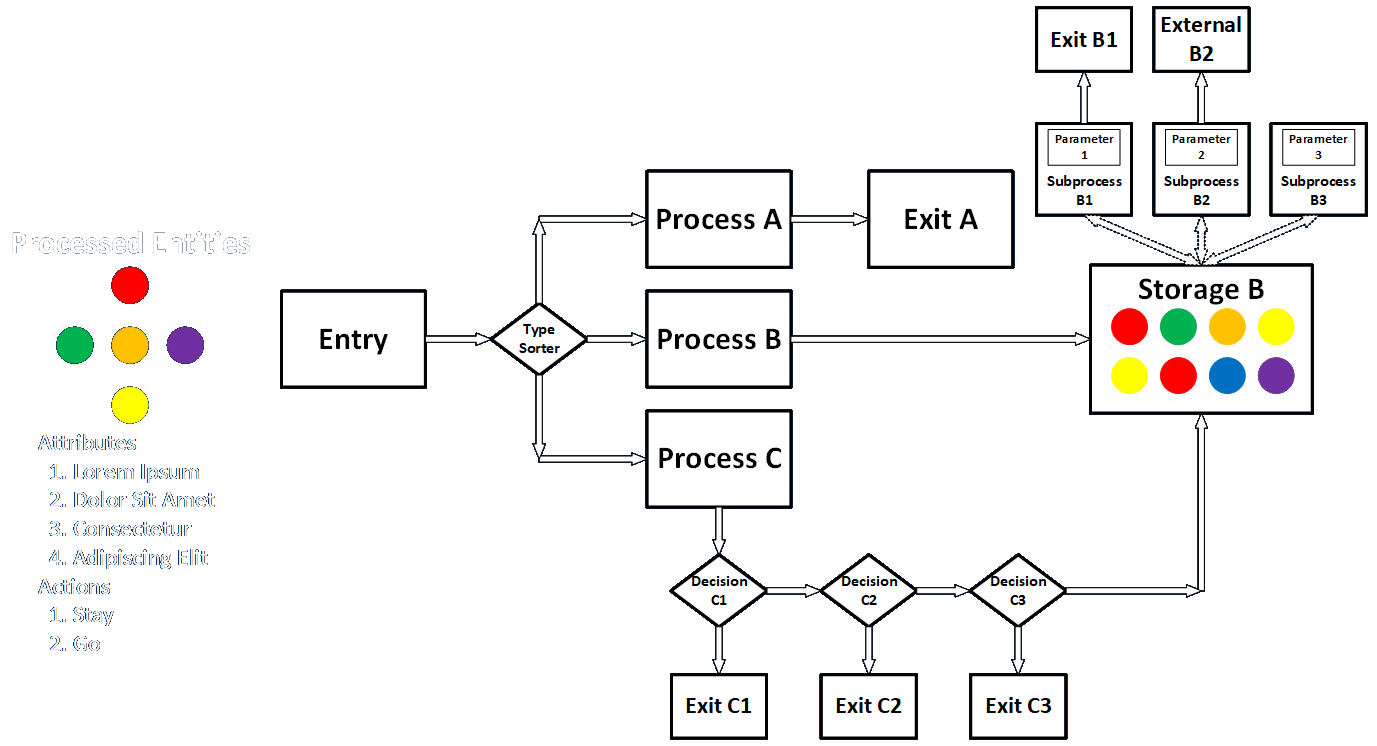
In the discussion we had in our weekly Tampa IIBA study group, we identified some of the following bases for establishing business rules. We identified only a small handful when we defined them as generally as show. Can you think of any more that would be equally general?

  • Follow defined procedures: The actions taken in the organization can be defined by business rules. In terms of the flowchart shown above, think about the overall shape of the process, the nature of processes and decisions in each box, and the nature of the entities that move within and through the process.
  • Sort based on immediate characteristic: Different actions may be taken based on defined but unchanging qualities (e.g., location, customer type, product, job function, etc.) of every entity. Such rules tend to be written as If A do X, Else If B do Y, Else do Z.
  • Sort based on changing characteristic: Different actions may be taken based on defined but changing qualities (often based on time) of every entity. These items are often held someplace, and are periodically checked to see if they’ve changed in a way that requires action, e.g., If Less Than 30 days do nothing, but when 30 days have passed change the status to overdue and send a message to the customer. Another example might involve quantities, e.g., If shelf quantity goes below three, Then order five more items.
  • Changeable parameters governing the above: In programming it’s usually a good idea to create named variables and constants for defined parameters rather than hard-coding them. This way, if the value is used in many places, it only needs to be changed once. Moreover, the name of the parameter gives insight into its potential meaning. For a business rule, and organization might change the time at which a payment is considered to be overdue from 30 days to 45 days. This might affect many decisions or only one, but it is defined and managed in a clear, modular way.

For those of you nerds (and I ask your forgiveness if my Javascript is a bit rusty), here is how the rules for the upper right corner of the business process might be expressed in code. This captures the actions taken, the decisions made, and the parameters governing the decisions.

Posted in Tools and methods | Tagged , , | Leave a comment

TWSL Series 06: Approach Contexts for Potential Solutions

Today I gave this webinar for the Tom Woods School of Life Lunch and Learn Series. The slides are here.

Posted in Tools and methods | Tagged , , , , | Leave a comment

Focus Groups and Workshops

Focus groups and workshops are separate techniques that involve getting a group of people together for a purpose, but the emphasis in each case is different. A focus group is generally intended to gather people’s reactions to a specific product, service, or situation, while a workshop may be convened for a wider variety of reasons.

Both techniques define an objective, establish a place, time, and procedures to be used, identify participants and roles (sponsor, moderator or facilitator, scribe, SME or other participant, and possibly timekeeper), conduct the discussions and other work, document the results, and follow up on any identified communications and action items. In both cases the organization will (presumably) take subsequent actions based on the insight gained.

Focus groups are often conducted to gauge the desirability or positioning of a new or existing consumer product, but this doesn’t always have to be the case.

Both techniques can gather a lot of information or accomplish other goals in a short period of time, because face-to-face interaction can enhance communication and understanding. Potential downsides include issues of trust, availability, factions, and other issues.

Posted in Tools and methods | Tagged , , | Leave a comment

TWSL Series 05: What Business Analysts Should Know About Software

Today I gave this webinar for the Tom Woods School of Life Lunch and Learn Series. The slides are here.

Posted in Tools and methods | Tagged , , , , | Leave a comment

TWSL Series 04: Engagement Phases In Detail

Today I gave this webinar for the Tom Woods School of Life Lunch and Learn Series. The slides are here.

Posted in Tools and methods | Tagged , , , | Leave a comment

Glossary

You all know what a glossary is. The BABOK struggles to find much to say about it. It is basically just a list of words and definitions used in the context of the operations being investigated. It is a good idea to create or maintain one when there a many new people in a situation, when you are working in a new industry, when you are using new solution techniques or components, or when engaged in domain knowledge acquisition generally. It is basically an aid to communication, and we know that business analysis is all about communication, especially when trying to translate between users/customers and various technical specialists.

Different terms of art tend to apply in different phases.

  • Intended Use: Problem statements are often expressed using broad and understandable language. However, organizational and engagement goals can absolutely refer to specific operations, technologies, or methods from specialized areas of practice. Moreover, the language of business, particularly with regard to financial, legal, and regulatory matters, can employ multiple terms of art.
  • Conceptual Model: This is where the language of the operation or solution being built or modified comes into play. It can involve equipment, processes, materials, operations, measurements (Canadian Standard Freeness remains the coolest measurement ever!), and even people (in the form of job descriptions).
  • Data: Data management and analysis has a certain vocabulary of its own because it is gathered in so many different ways and has so many different characteristics both singularly and en masse.
  • Requirements: Language in this phase tends to use terminology primarily defined elsewhere, although it’s good to be aware of different kinds of requirements (e.g., functional vs. non-functional, business/stakeholder/solution/transition, and so on).
  • Design: Work in this phase tends to use language defined elsewhere as well.
  • Implementation: Implementation tends to require a wide variety of specialized practitioners, each of which may use specialized verbiage. Software engineers have a large and specialized vocabulary, management frameworks, computer languages, programming paradigms, and the like, but there are many types of practitioners, ranging from pipefitters to graphic artists.
  • Test and Acceptance: There are almost limitless ways to verify and validate solutions. Software is just one field and that process has plenty of its own verbiage and even equipment and processes.
Posted in Tools and methods | Tagged , , | Leave a comment

TWSL Series 03: What Is Business Analysis?

Today I gave this webinar for the Tom Woods School of Life Lunch and Learn Series. The slides are here.

Posted in Tools and methods | Tagged , , , | Leave a comment

TWSL Series 02: Framework Introduction

Today I gave this webinar for the Tom Woods School of Life Lunch and Learn Series. The slides are here.

Posted in Tools and methods | Tagged , , , | Leave a comment

Metrics and Key Performance Indicators (KPIs)

Metrics and KPIs indicate how an operation or system is performing relative to trend or a defined goal. They may take the form of point values (ninety-five percent uptime for a manufacturing process), ranges (plus or minus one percent of target), or probabilities (less than fifteen minute wait time, eighty-five percent of the time). They can be measured over time periods of any length.

Many types of values can drive decisions, but what makes something a metric or KPI is how the decision relates to strategic organizational goals. For example, a data point associated with a document or a record may affect whether that item is diverted to one processing operation or another. That data point drives a decision (and potentially thousands of them a day), but that decision does not indicate progress toward a goal or standard. Providing service in an effective and timely manner, reducing waster, hitting quality or financial targets, and meeting or exceeding market standards are all examples of strategic assessments and can be thought of as governing metrics.

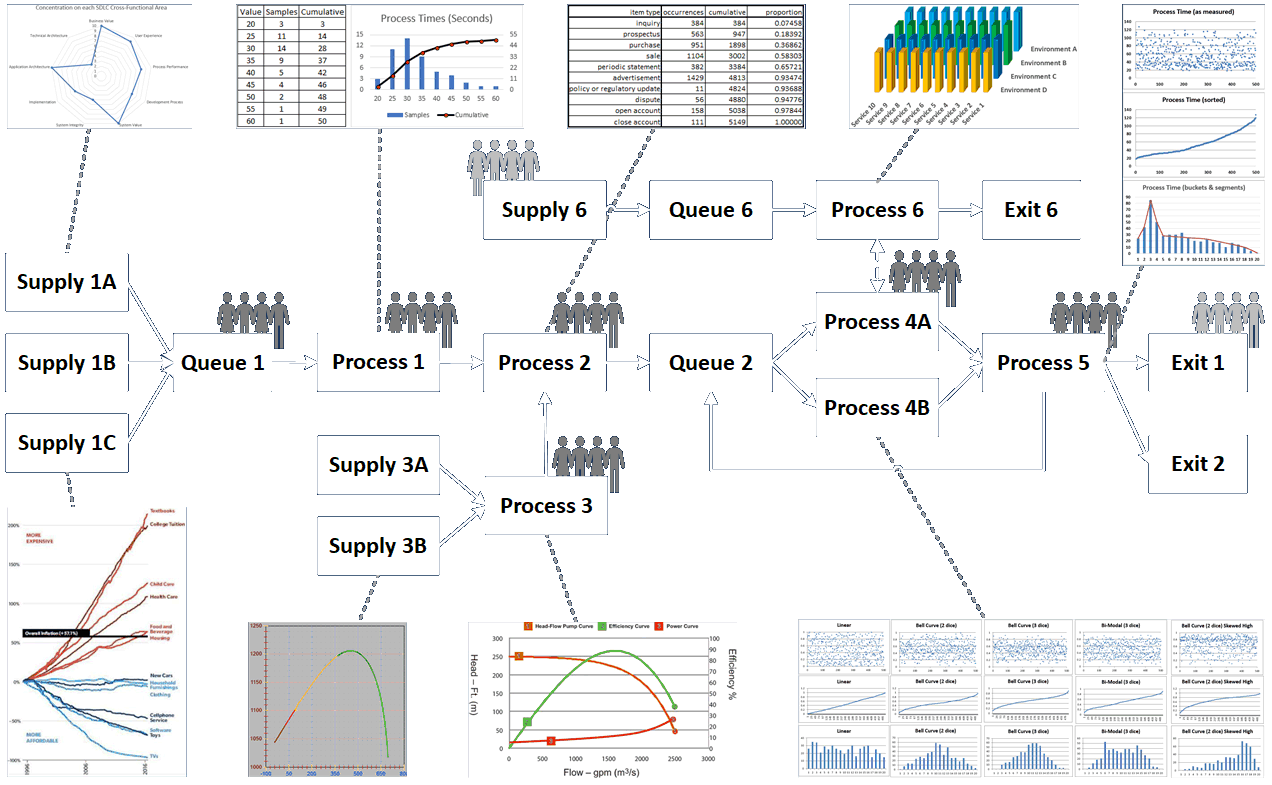
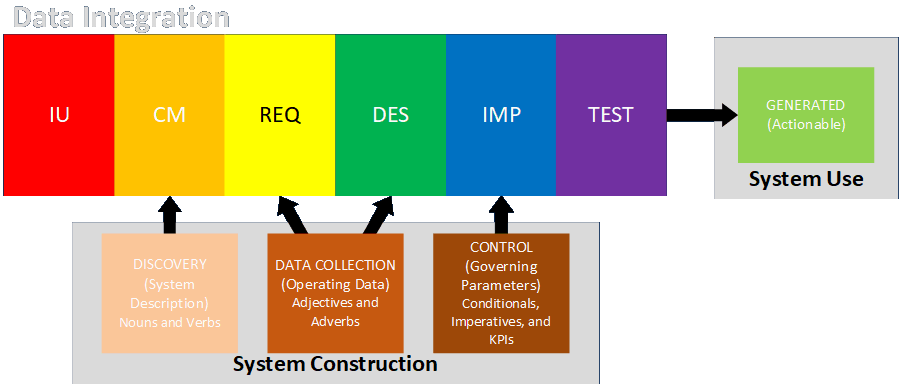
Note that values that serve as metrics and KPIs are likely to be derived from the operation of a running process or system, as shown above (at least in part), and not values that describe or govern it, as shown below. Note also that the above figure, at least in this context, refers to a working solution, while the figure below describes the engagement during which it was created or modified.

Indicators may take many forms, but should have many of the following important characteristics (item names from the BABOK, think about how this advice is similar to that for writing user stories):

  • Clear: understandable and without ambiguity
  • Relevant: germane to the activity
  • Economical: obtainable without excess time and effort
  • Adequate: embodies enough information to provide effective guidance
  • Quantifiable: can be expressed in values that can be validated
  • Trustworthy and Credible: deriving from agreed-upon, accurate, authoritative sources

It’s nice when metrics are expressed in terms of simple values, but they can become very complex and synthetic. I worked on one program that tried to improve the “readiness” of large quantities of equipment. The equipment needed a high degree of maintenance and inspection, and was considered “not ready” whenever such work was waiting to be performed or even in progress. As a result, the value of the metric (expressed as a percentage), turned out to be surprisingly low. However, small changes to that value were regarded as highly significant. The important thing is to understand the source, derivation, and context of the metric or KPI, no matter what form it takes. (I could tell you some other stories about that and other programs, but those are discussions for another day. Ask me over a coffee sometime.)

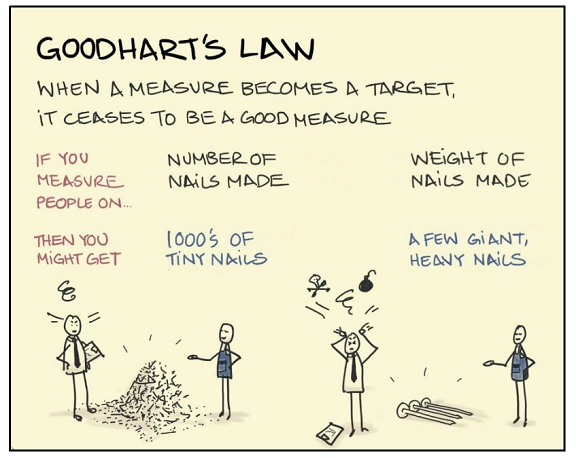
Another issue with KPIs is that they may not capture what is really wanted. For example, I recently encountered a situation where a manager established a goal of having an eighty percent “win rate” for sales encounters. Someone else asked the question of whether the metric would have the desired effect. Going back into history, industrial planners in the former Soviet Union used to set quotas for the production of nails. The problem was that the KPI was expressed in tons of nails, and this was done without consideration of how difficult different kinds of nails were to make. As a result, producers tended to manufacture nails that were easier to produce. Since thicker and wide-headed framing nails are easier to produce than finer and small-headed roofing nails, the shortages of roofing nails were so severe that buildings would be constructed all over the place — except for the roofs. This rendered the buildings unusable and they would just sit and rot in the weather.

The Soviet nail example is meant to illustrate the advantages of the price system, where the (presumably higher) price of roofing nails incentivizes producers to manufacture what is needed.

I don’t know if we always have to go as far as saying Goodhart’s Law is always applicable, but one has to be mindful of what is being measured and what it means.

Returning the “win rate” example I started with, is the real goal to ensure that sales teams get wins at a certain rate, or is it to make the most sales? Or is it to make the most sales per a given amount of effort? Or is it to bring in the most money? One possible problem with targeting the win rate alone is that tales teams may game who they try to sell to, or they may do inappropriate things (like reduce the price to buy sales, thus lowering the brand’s value). None of those are desirable.

Metrics and KPIs should be revisited and reviewed over time to ensure they represent what is wanted, and that they incentivize the desired actions. I often mention the need to be thorough, and to look at problems from multiple points of view. As always, different people with different perspectives should be consulted where it makes sense. I try to illustrate this by including the image below in many of the talks I give.

Posted in Tools and methods | Tagged , , | Leave a comment

TWSL Series 01: Simulation

Today I gave this webinar for the Tom Woods School of Life Lunch and Learn Series. The slides are here.

Posted in Tools and methods | Tagged , , , | Leave a comment