A Simulationist's Framework
for Business Analysis
Part 08:
Data
How To Get It and How To Use It
R.P. Churchill
CBAP, PMP, CSPO, CSM, CSDLean Six Sigma Black Belt
www.rpchurchill.com/presentations/TWSLseries/08_Data www.rpchurchill.com | Portfolio | Presentations
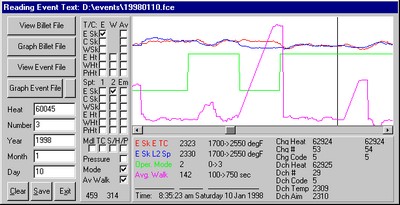
30 Years of Simulation
Continuous simulation of the heating of a square billet and Discrete-Event simulation of a multi-phase process.
30 Years of Simulation
|
Industries
|
|
|
Previous Talks About Data

My friend Richard Frederick gave an excellent series of twenty talks on data from August 2020 through January 2021, and I highly encourage you to review them at your convenience.
I've done this for a long time and I learned a lot from him.
The videos and PDFs from his talks may be found here.
The Framework:
- Project Planning
- Intended Use
- Assumptions, Capabilities, Limitations, and Risks and Impacts
- Conceptual Model (As-Is State)
- Data Sources, Collection, and Conditioning
- Requirements (To-Be State: Abstract)
- Functional (What it Does)
- Non-Functional (What it Is, plus Maintenance and Governance)
- Design (To-Be State: Detailed)
- Implementation
- Test
- Operation, Usability, and Outputs (Verification)
- Outputs and Fitness for Purpose (Validation)
- Acceptance (Accreditation)
- Project Close
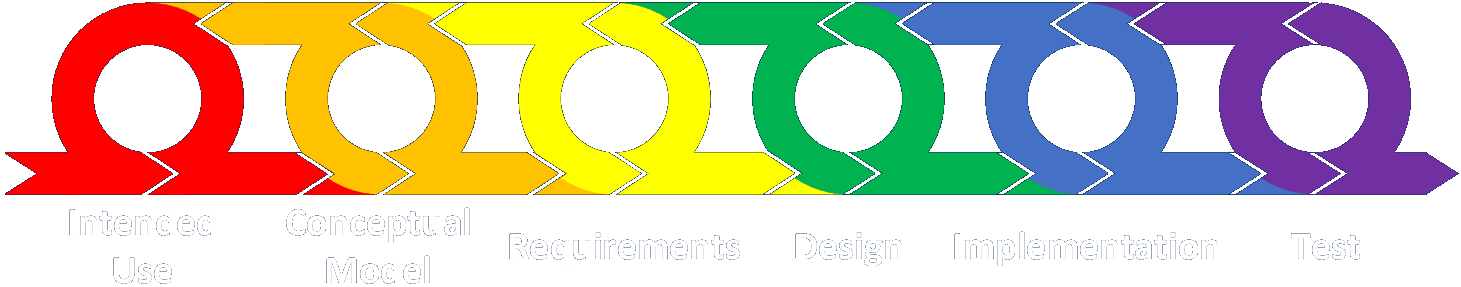
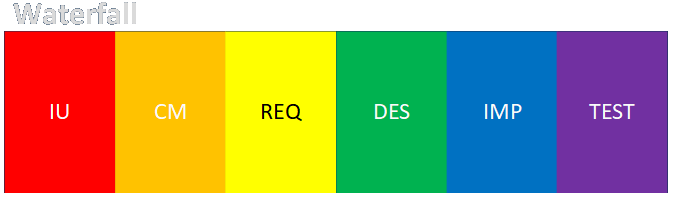
The Framework: Simplified
 Intended Use
 Conceptual Model (As-Is State)
 Data Sources, Collection, and Conditioning
 Requirements (To-Be State: Abstract)
- Functional (What it Does)
- Non-Functional (What it Is, plus Maintenance and Governance)
 Design (To-Be State: Detailed)
 Implementation
 Test
Test- Operation, Usability, and Outputs (Verification)
- Outputs and Fitness for Purpose (Validation)
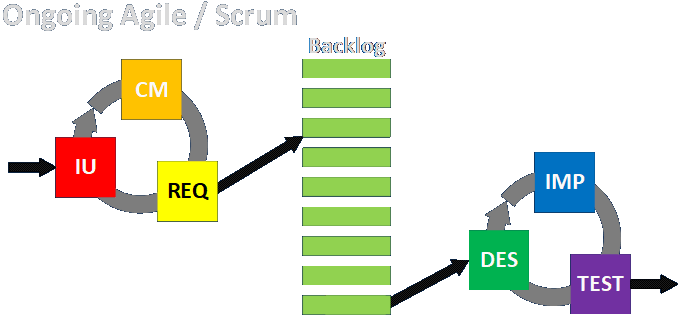
Customer Feedback Cycle
Agile is Dead (in a rigorously formal sense)
Basic Engagement Structures
Link to detailed discussion.
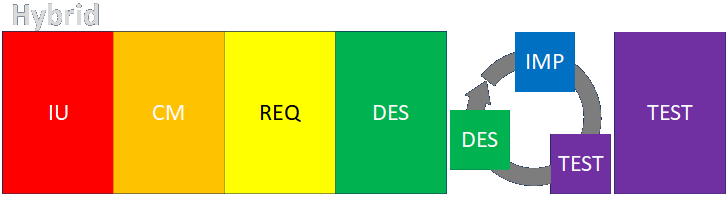
Engagement Structure Variations
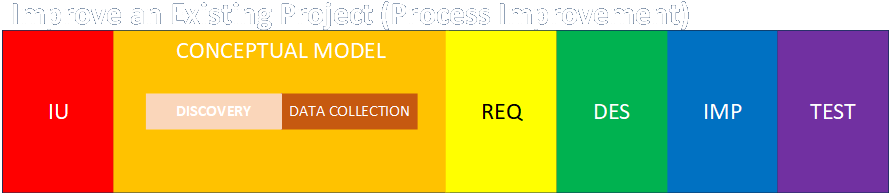
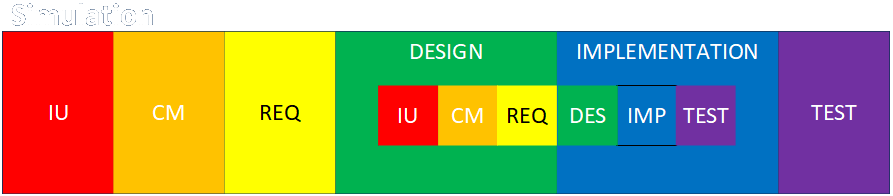
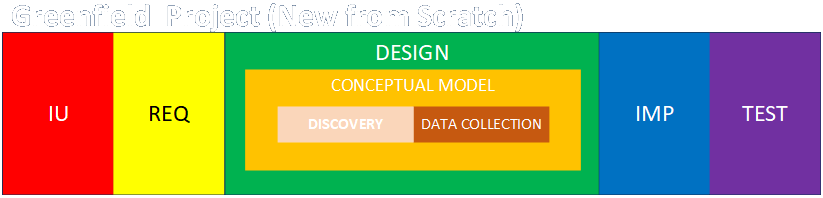
Link to detailed discussion.
Engagement vs. System vs. Solution
The engagement is what we do to effect a change that serves customers.
The system is what we analyze and either build or change to serve customers.
The solution is the change we make to serve customers.
Data Is Always Part of the Engagement
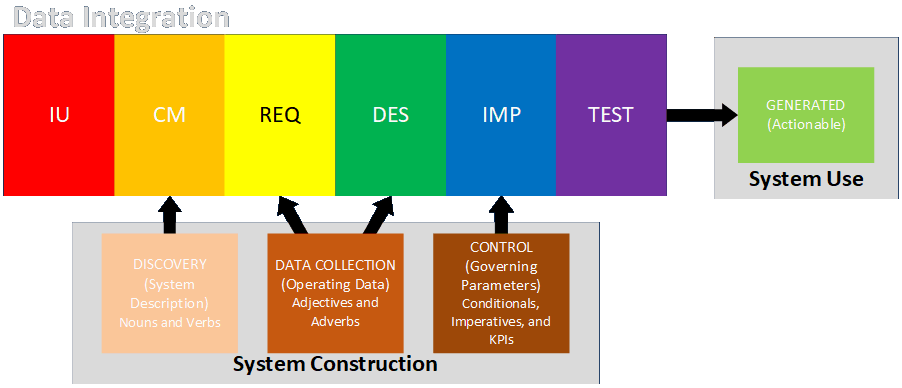
- System Description: data that describes the physical or conceptual components of a process (tends to be low volume and may describe mostly fixed characteristics)
- Operating Data: data that describe the detailed behavior of the components of the system over time (tends to be high volume and analyzed statistically)
- Governing Parameters: thresholds for taking action (control setpoints, business rules, largely automated or automatable)
- Generated Output: data produced by the system that guides business actions (KPIs, management dashboards, drives human-in-the-loop actions, not automatable)
Links to detailed discussions.
Classes of Data 1/4: System Description
Some basic descriptive information can be collected during discovery, but the more detailed information is gleaned during data collection.
Examples of data that describe systems and entities include:
- Current and predicted demand
- Arrival rates by time period
- Entity descriptions and classifications (travelers, customers, suppliers, products, documents, data items, etc.)
- Operating hours for operations and locations
- Capabilities of resources (production rates, chances of success, ability to handle specialized situations)
- Staffing levels and resource availability
- Overhead claims for maintenance and administration
- Capacity information (storage volumes or spaces, memory allocation, queue sizes)
- Throughput information (bandwidth, communication channels, pipe sizes, transport capacities)
- Locations and routing
- Modularly defined business rules
Think adjectives and adverbs as opposed to nouns and verbs.
Classes of Data 2/4: Operating Data
This includes current and historical information about how the process is running.
Current information can be used for ongoing control, feedback, resource management (phone lights, grocery checkouts), identification of potential problems, safety, training, standards of performance, and so on.
Historical information can be used to show contractual terms are being met, for research, and to identify changes over time, in both the process and the entities processed (seasonal chip energy, port arrivals).
Classes of Data 3/4: Governing Parameters
Decisions may be driven on the basis of changeable parameters. Numeric thresholds are often used to this purpose, but modularly defined procedural rules can also be a form of data.
Many such rules will be identified in the conceptual model and requirements phases, but implementation SMEs might identify more in the design and implementation phases.
Link to detailed discussion.
Classes of Data 4/4: Generated Output
Consideration of ultimate outputs really happens through every phase.
Not all systems output data as such. Data may only be used to run the process. Be mindful of the scope and scale of the current engagement.
Some forms of output are data but aren't really data in this sense. For example, a movie service may output a huge volume of data as audio/video streams, but for this discussion we're only concerned with the descriptive and operating metadata (e.g., viewing rates, bandwidth limitations, network problems, permission foul-ups, video quality, etc.)
Organizations may provide different forms of output for different interests and at different scales (production data, pricing data, financial results, regulatory reporting, marketing, customer service follow-up, etc.).
Whether a data items is considered operating data or output data may only be a matter of the scale at which you're thinking and the purposes the items serve, but it's good to have this distinction in mind to help you see things from more angles.
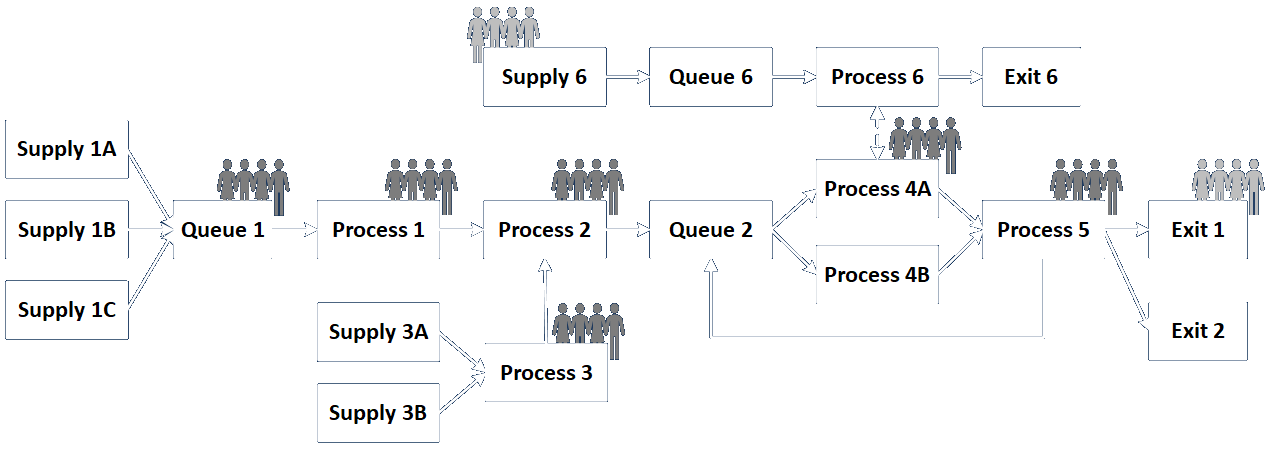
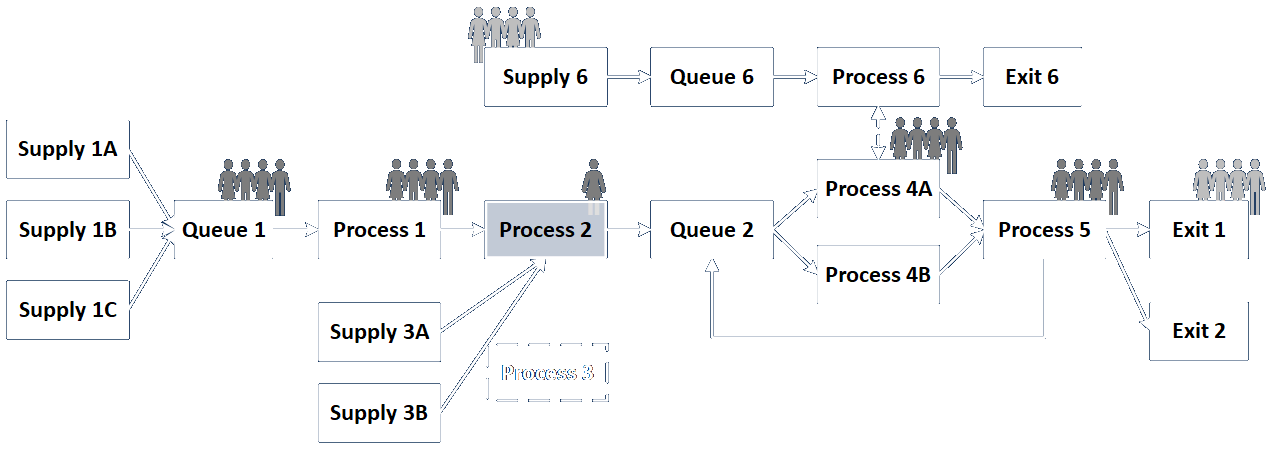
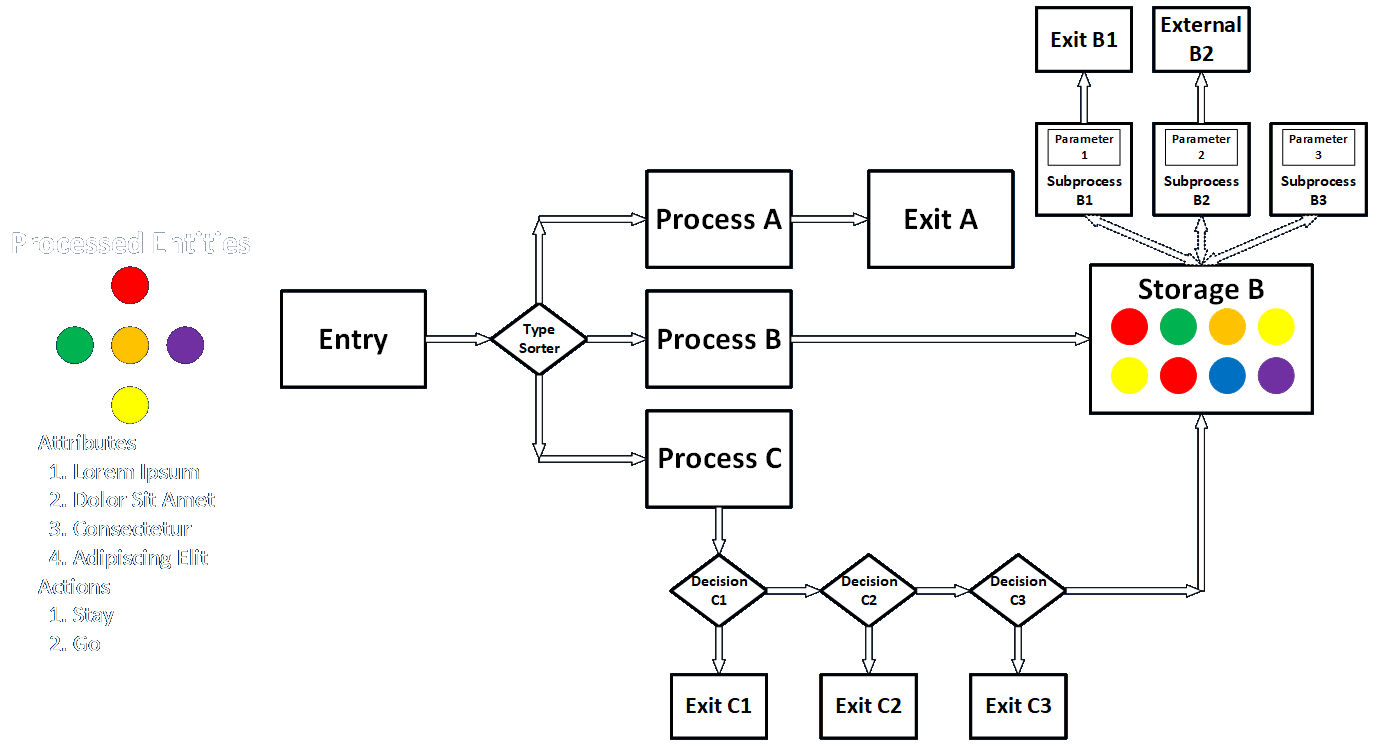
Data Goes In and Out of Every System Component
Every process and component can involve any and all classes of data.
Data Goes In and Out of Every System Component
|
Identify...
|
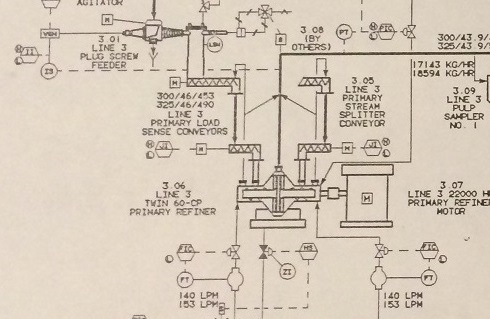
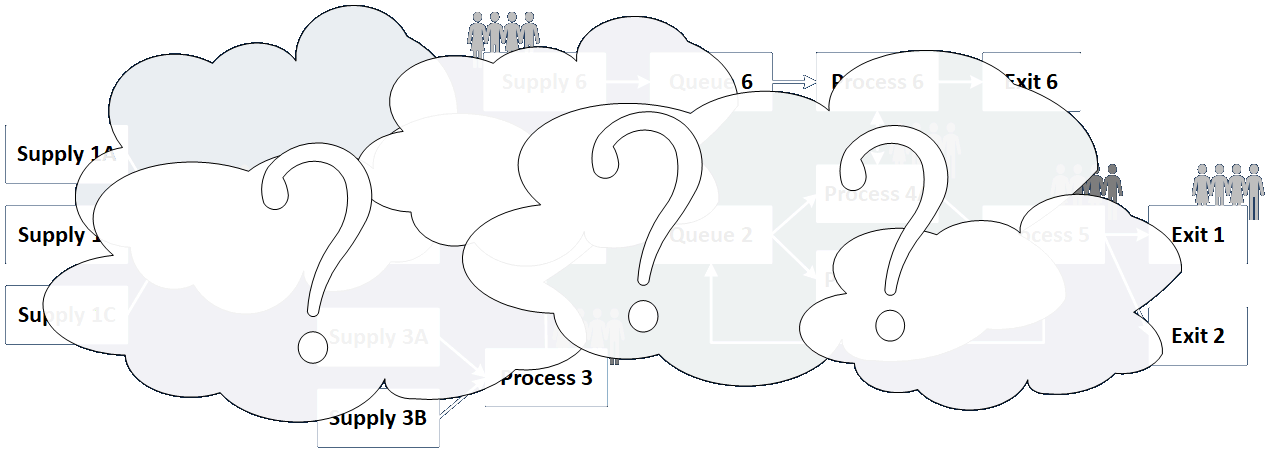
Discovery vs. Data Collection
Discovery is a qualitative process. It identifies nouns (things) and verbs (actions, transformations, decisions, calculations).
|
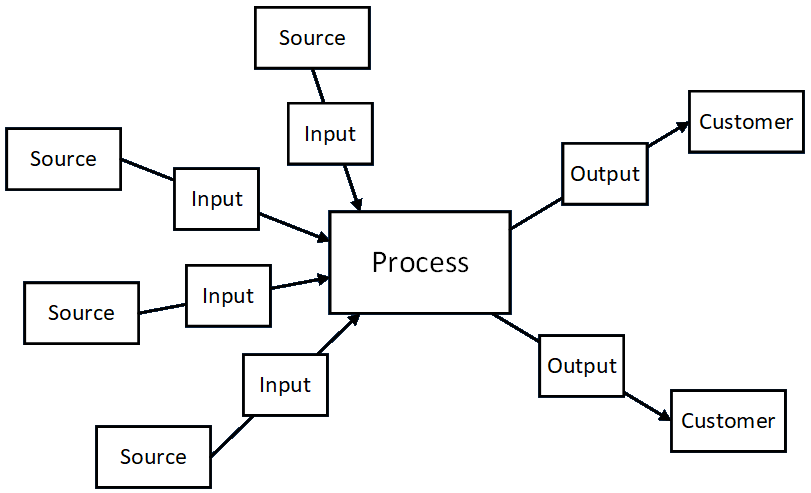
It's how you go from this... |
...to this. |
|
|
|
|
Discovery comes first, so you know what data you need to collect.
Elicitation is discovering the customer's needs. Discovery is about mapping the customer's existing process — or — it's what you design by working back from the desired outcomes.
Link to detailed discussion.
Discovery vs. Data Collection (continued)
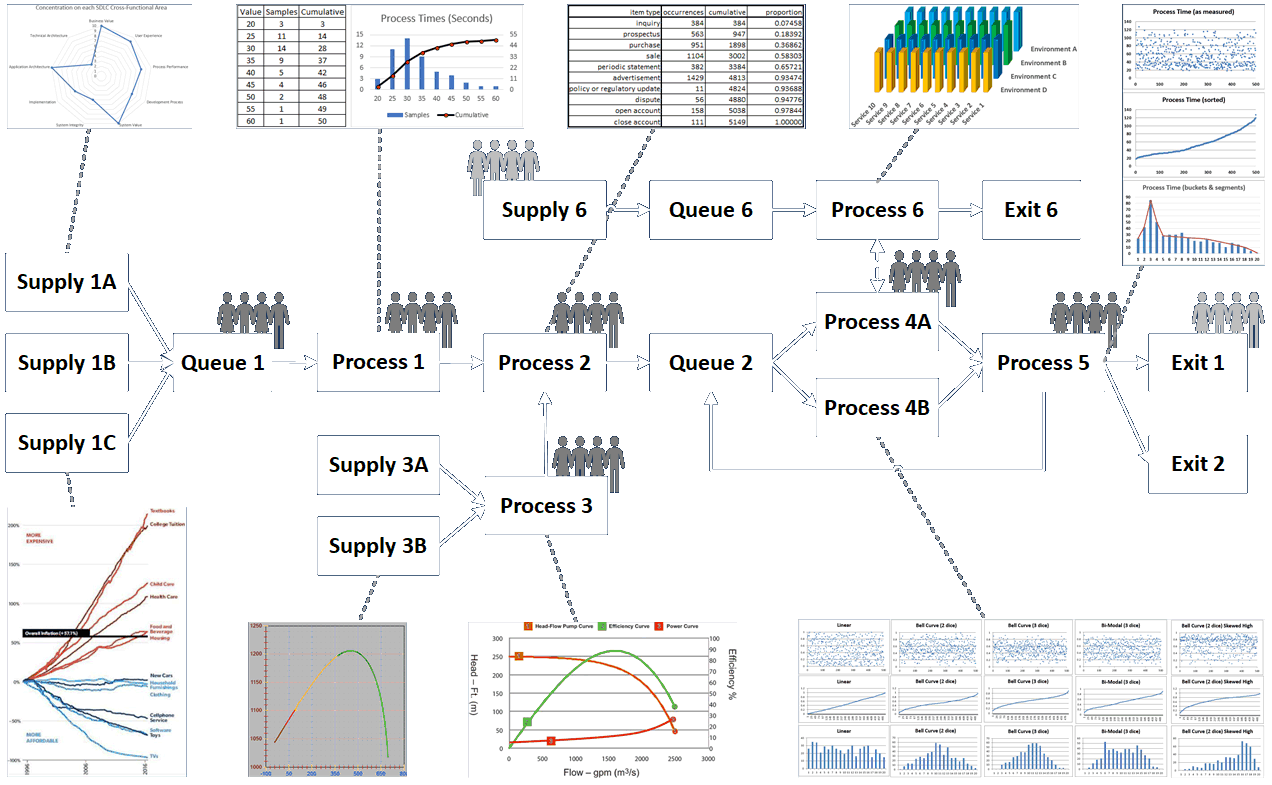
Data Collection is a quantitative process. It identifies adjectives (colors, dimensions, rates, times, volumes, capacities, materials, properties).
|
It's how you go from this... |
...to this. |
|
|
|
|
|
Think about what you'd need to know about a car in the context of traffic, parking, service (at a gas station or border crossing), repair, insurance, design, safety, manufacturing, marketing, finance, or anything else.
Methods of Discovery
|
|
It doesn't happen by accident!
Methods of Data Collection
|
|
Characteristics of Data
- Measure: A label for the value describing what it is or represents
- Type of Data:
- numeric: intensive value (temperature, velocity, rate, density – characteristic of material that doesn't depend on the amount present) vs. extensive value (quantity of energy, mass, count – characteristic of material that depends on amount present)
- text or string value: names, addresses, descriptions, memos, IDs
- enumerated types: color, classification, type
- logical: yes/no, true/false
- Continuous vs. Discrete: most numeric values are continuous but counting values, along with all non-numeric values, are discrete
- Deterministic vs. Stochastic: values intended to represent specific states (possibly as a function of other values) vs. groups or ranges of values that represent possible random outcomes
Link to detailed discussion.
Characteristics of Data (continued)
- Possible Range of Values: numeric ranges or defined enumerated values, along with format limitations (e.g., credit card numbers, phone numbers, postal addresses)
- Goal Values: higher is better, lower is better, defined/nominal is better
- Samples Required: the number of observations that should be made to obtain an accurate characterization of possible values or distributions
- Source and Availability: where and whether the data can be obtained and whether assumptions may have to be made in its absence
- Verification and Authority: how the data can be verified (for example, data items provided by approved individuals or organizations may be considered authoritative)
Link to detailed discussion.
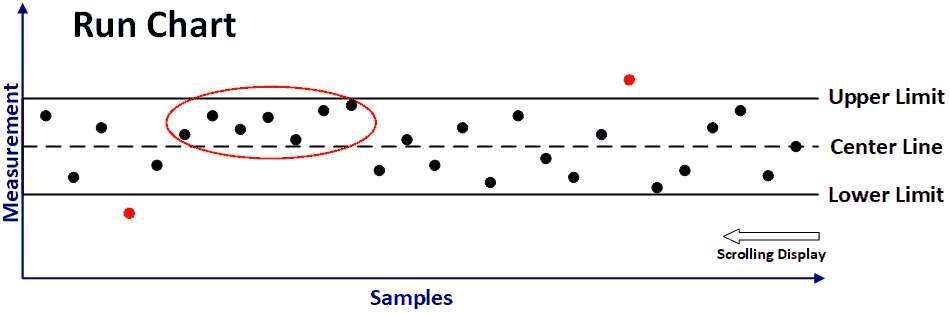
Required Sample Size
There are many forms of this (rather chicken-and-egg) equation, but this one is fairly common:
n >= (z ⋅ σ / MOE)2
where:
n = minimum sample size (should typically be at least 30)
z = z-score (e.g., 1.96 for 95% confidence interval)
σ = sample standard deviation
MOE = measure of effectiveness (e.g., difference between sample and population means in units of whatever you're measuring)
Document all procedures and assumptions!
Link to detailed discussion.
Conditioning Data
Complete data may not be available, and for good reason. Keeping records is sometimes rightly judged to be less important than accomplishing other tasks.
Here are some options* for dealing with missing data (from Udemy course R Programming: Advanced Analytics In R For Data Science by Kirill Eremenko):
- Predict with 100% accuracy from accompanying information or independent research.
- Leave record as is, e.g., if data item is not needed or if analytical method takes this into account.
- Remove record entirely.
- Replace with mean or median.
- Fill in by exploring correlations and similarities.
- Introduce dummy variable for "missingness" and see if any insights can be gleaned from that subset.
* These mostly apply to individual values in larger data records.
Document all procedures and assumptions!
Conditioning Data (continued)

Wreckage of Mars Polar Lander: Why To Make Sure Your Units Match |
Data from different sources may need to be regularized so they all have the same units, formats, and so on. (This is a big part of ETL efforts.) Sanity checks should be performed for internal consistency (e.g., a month's worth of hourly totals should match the total reported for the month). Conversely, analysts should be aware that seasonality and similar effects mean subsets of larger collections of data may vary over time. Data items should be reviewed to see if reporting methods or formats have changed over time. Data sources should be documented for points of contact, frequency of issue, permissions and sign-offs, procedures for obtaining alternate data, and so on. I have been known to embed reference information in various systems, especially in systems that automated the production of coefficients, documentation, code, and simulations. |
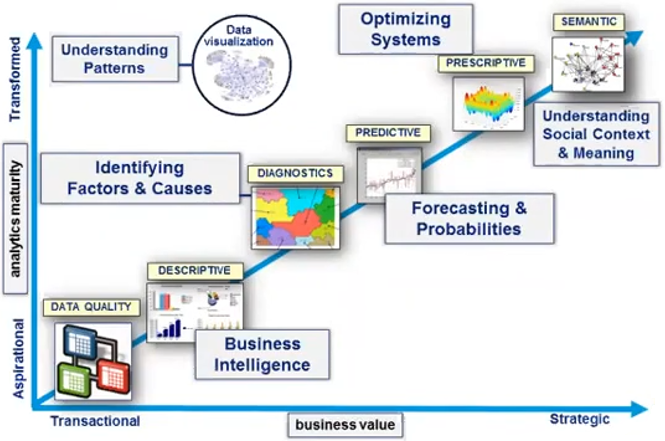
Handling of Data Gets More Abstract Over Time
...as data is becoming more voluminous, and as what can be done with it is more powerful and valuable.
This presentation and other information can be found at my website:
E-mail: bob@rpchurchill.com
LinkedIn: linkedin.com/in/robertpchurchill