
Item tracking is how participants in an effort monitor what concerns, issues, and tasks are valid and need to be addressed, and who has responsibility. Items can arise in any phase of an engagement and be tracked through any other phase, including during the extended operation and maintenance phase.
Items may incorporate the following attributes, according to the BABOK. I think some of these are redundant, but tracking systems like Jira and Rally embody them by default, and can be customized to include the others. More importantly, if you look back to your own experience, you can see that most of these are implicitly present even if not formally acknowledged.
- Item Identifier: A unique identifier that serves as a key so the item can be found.
- Summary: A description of the issue that includes text and possibly images, diagrams, and media.
- Category: A key that can be used to group the item with similar items.
- Type: The kind of item. (Similar to category?) (Create as needed for your unique situation.)
- Date Identified: Date and time the issue was raised (and introduced into the system).
- Identified By: Name (and contact information) of individual(s) who identified or raised the issue.
- Impact: What happens if the item is not resolved. May include specified times for milestones and completion.
- Priority: An indication of the item’s importance and especially time requirements.
- Resolution Date: Times by which milestones must be reached or by which the item must be resolved.
- Owner: Who is responsible for marshaling the item through to completion.
- Resolver: Who is responsible for resolving the item.
- Agreed Strategy: Method for approaching or resolving the item. The BABOK presents options akin to those used in risk analysis (e.g., accept, pursue, ignore, mitigate, avoid), but others are possible.
- Status: The current state of the item. Items may have their own life cycles (e.g., opened, assigned, in work, in testing, resolved, canceled, rejected). See below for further discussion.
- Resolution Updates: A log of activities and status updates detailing the item’s disposition.
- Escalation Matrix: What to do and who should do it if the item is not resolved in the allotted time.
Each organization, and even each engagement, may have its own standard procedures and vocabulary for handling items through their life cycle. When I wrote models for nuclear power plant simulators at Westinghouse we usually had three or four projects going at once, and all of them named some of their work items differently. We had DRs, TRs, and PRs, for deficiency reports, trouble reports, and problem reports at the very least, depending I think on the customer’s preferred language.
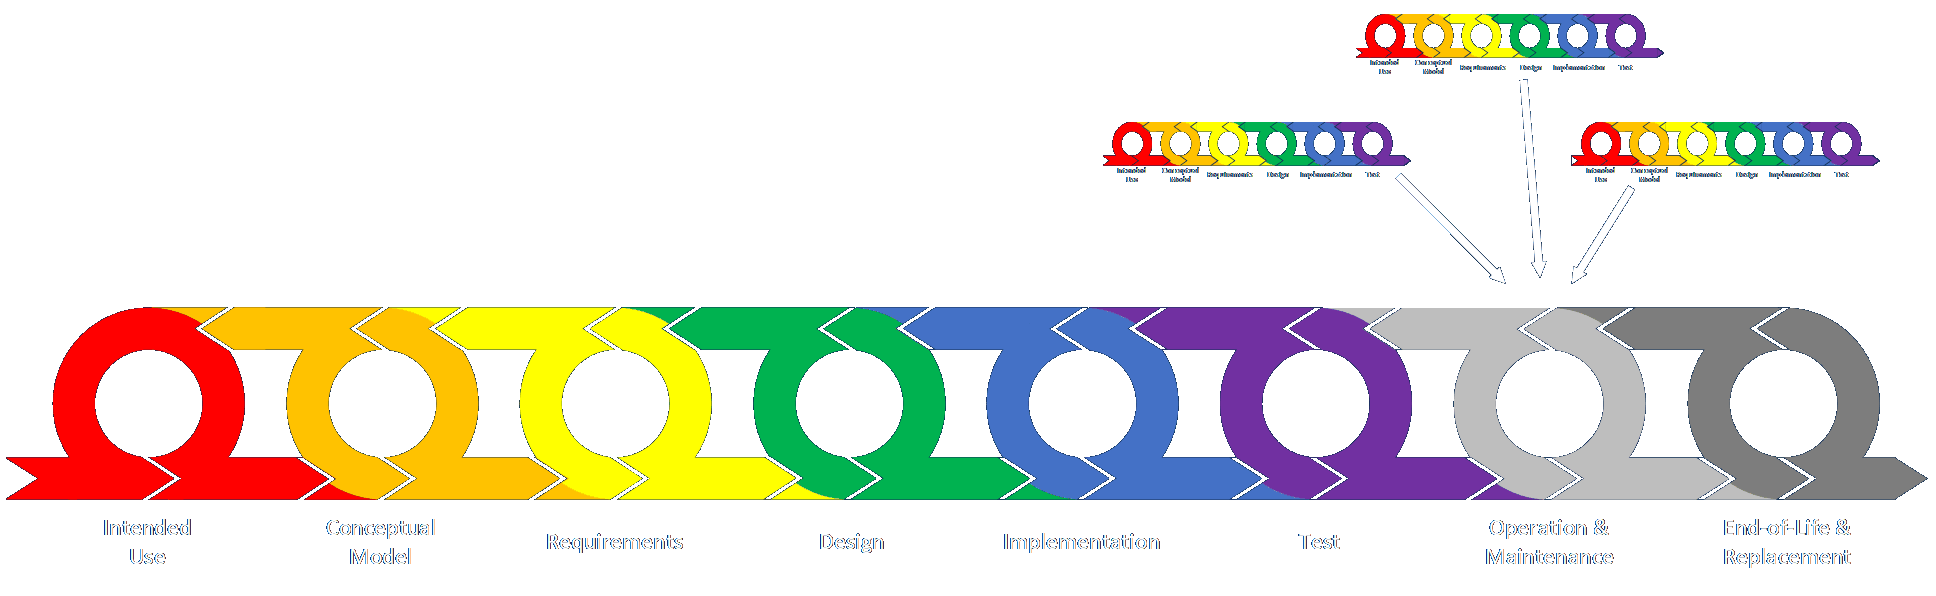
I’ve written about using systems like Jira for tracking items through the entire engagement life cycle (here), but a few years later I can see that the idea should be expanded to include an independent life cycle for items within each phase of my framework, and that may be different for different phases. For example, the life cycle for implementation items might be something like assigned, in work, in bench testing, completed (and forwarded to testing). The cycle for conceptual model items might be very different, since it involves performing discovery operations through tours, interviews, research, calculations, and data collection, and then documenting the many identified elements and circulating them for review and correction. I should do a specific write-up on this.
Statistics can be compiled on the processing and disposition of items, so the engagement teams and customers can understand and improve their working methods. Care should be taken to be aware of potential variances in the complexity and requirements of each item, so any resultant findings can be interpreted accurately and fairly.
As mentioned above, items can arise and be tracked and resolved in and through all phases in an engagement’s or product’s full life cycle. In my career I’ve seen individually tracked items mostly come from testing, customer concerns, and to do lists generated by the solution teams themselves. We often called them punch lists as projects were advancing toward completion and the number of outstanding items became small enough to be listed and attacked individually. But, depending on the maturity and complexity of your organization and your effort, you’ll want to carefully consider what system you impose on a working project. You want it to be complex enough to be powerful and clarifying for all participants, but not so overwhelming that interacting with it is almost a larger burden than the actual work. That is, it should enhance the working environment, and not impede it.
What systems have you seen for tracking items?

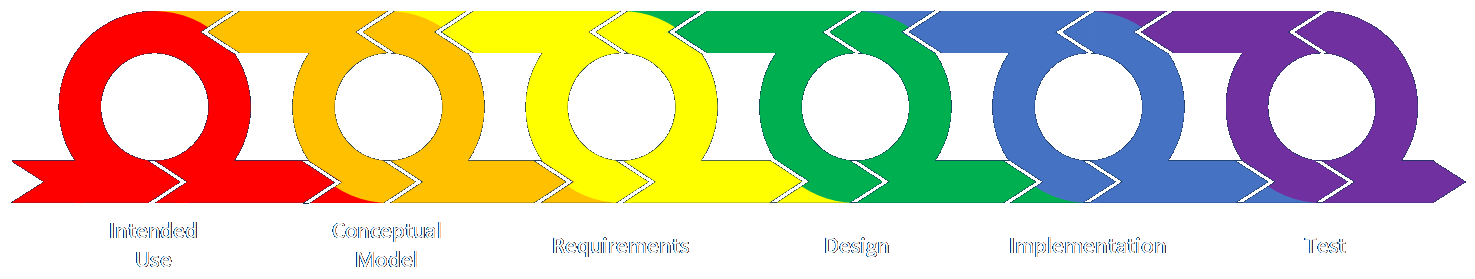

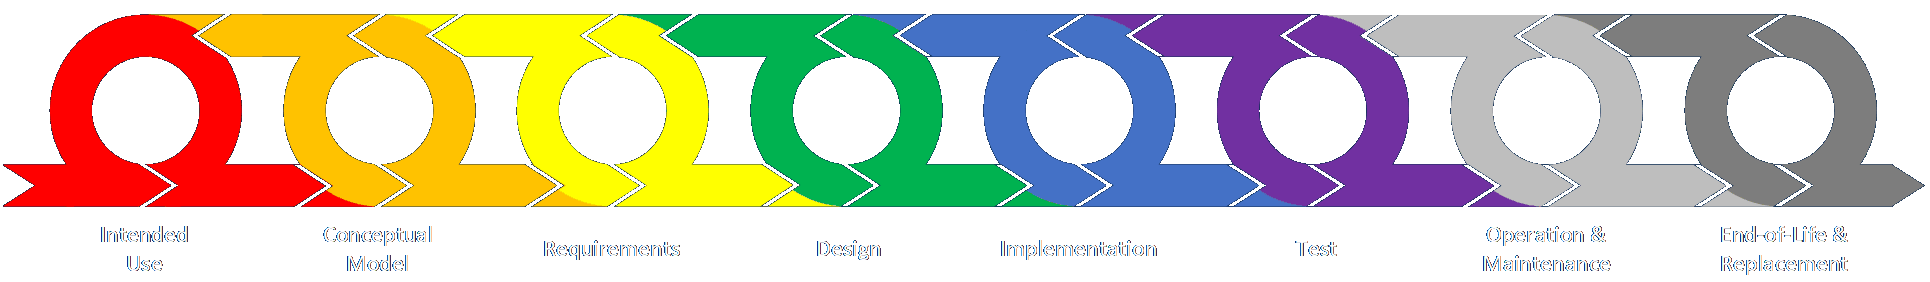
 Intended Use
 Conceptual Model (As-Is State)
 Data Sources, Collection, and Conditioning
 Requirements (To-Be State: Abstract)
 Design (To-Be State: Detailed)
 Implementation
 Test
Test Operation and Maintenance
 End-of-Life and Replacement