
Maintaining a dictionary of data items is a very good idea for engagements of sufficiently wide scope and involving enough participants. This greatly simplifies and clarifies communication and mutual understanding among all participants, and should fall out of the work naturally while continuously iterating within and between phases.
Data can be classified in many different ways, and all of them can be included in the description of each data item.
The context of data (my own arbitrary term) describes the item’s conceptual place within a system. (I described this in a webinar.)
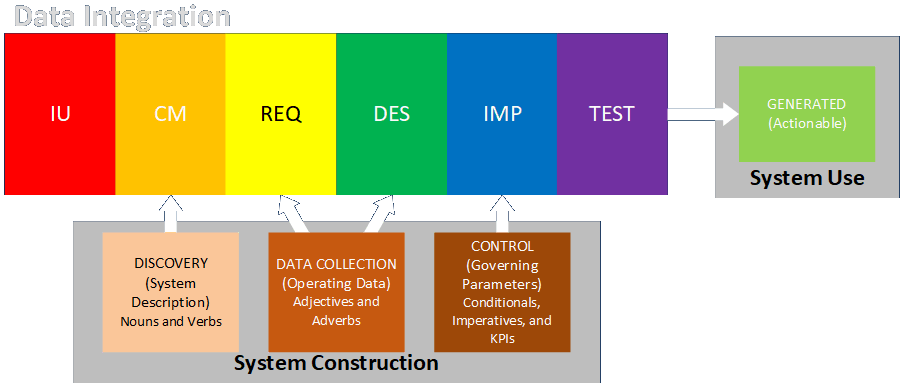
- System Description: data that describes the physical or conceptual components of a process (tends to be low volume and describes mostly fixed characteristics)
- Operating Data: data that describe the detailed behavior of the components of the system over time (tends to be high volume and analyzed statistically); these components include both subprocesses within the system and items that are processed by the system as they enter, move through or within, and exit the system.
- Governing Parameters: thresholds for taking action (control setpoints, business rules, largely automated or automatable)
- Generated Output: data produced by the system that guides business actions (KPIs, management dashboards, drives human-in-the-loop actions, not automatable)
The class of data (my own arbitrary term again) describes the nature of each data item.
- Measure: A label for the value describing what it is or represents
- Type of Data:
- numeric: intensive value (temperature, velocity, rate, density – characteristic of material that doesn't depend on the amount present) vs. extensive value (quantity of energy, mass, count – characteristic of material that depends on amount present)
- text or string value: names, addresses, descriptions, memos, IDs
- enumerated types: color, classification, type
- logical: yes/no, true/false
- Continuous vs. Discrete: most numeric values are continuous but counting values, along with all non-numeric values, are discrete
- Deterministic vs. Stochastic: values intended to represent specific states (possibly as a function of other values) vs. groups or ranges of values that represent possible random outcomes
- Possible Range of Values: numeric ranges or defined enumerated values, along with format limitations (e.g., credit card numbers, phone numbers, postal addresses)
- Goal Values: higher is better, lower is better, defined/nominal is better
- Samples Required: the number of observations that should be made to obtain an accurate characterization of possible values or distributions
- Source and Availability: where and whether the data can be obtained and whether assumptions may have to be made in its absence
- Verification and Authority: how the data can be verified (for example, data items provided by approved individuals or organizations may be considered authoritative)
- Relationship to Other Data Items: This involves situations where data items come in defined sets (from documents, database records, defined structures, and the like), and where there may be value dependencies between items.
It is also important to identify approaches for conditioning data. Complete data may not be available, and for good reason. Keeping records is sometimes rightly judged to be less important than accomplishing other tasks. Here are some options for dealing with missing data (from Udemy course R Programming: Advanced Analytics In R For Data Science by Kirill Eremenko):
- Predict with 100% accuracy from accompanying information or independent research.
- Leave record as is, e.g., if data item is not needed or if analytical method takes this into account.
- Remove record entirely.
- Replace with mean or median.
- Fill in by exploring correlations and similarities.
- Introduce dummy variable for “missingness” and see if any insights can be gleaned from that subset.
More considerations for conditioning data include:
- Data from different sources may need to be regularized so they all have the same units, formats, and so on. (This is a big part of ETL efforts.) Note that an entire Mars probe was lost because two teams did not ensure the interface between two systems used consistent units.
- Sanity checks should be performed for internal consistency (e.g., a month’s worth of hourly totals should match the total reported for the month).
- Conversely, analysts should be aware that seasonality and similar effects mean subsets of larger collections of data may vary over time.
- Data items should be reviewed to see if reporting methods or formats have changed over time.
- Data sources should be documented for points of contact, frequency of issue, permissions and sign-offs, procedures for obtaining alternate data, and so on.