
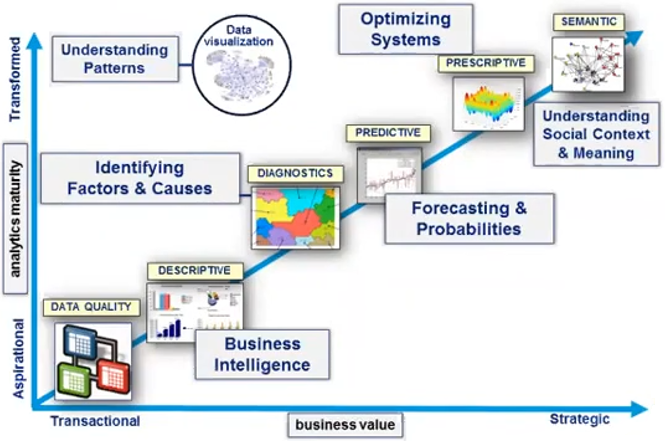
Data mining is the processing of large quantities of data to glean useful insights and support decision-making. Descriptive techniques like generating graphical depictions or applying other methods allow users to identify patterns, trends, or clusters. Diagnostic techniques like decision trees or segmentation can show why patterns exist. Predictive techniques like regression or neural networks can guide predictions about future outcomes. The latter are the general purview of machine learning and (still-nascent-and-will-remain-so-for-a-long-time) AI techniques, along with simulation and other algorithms.
Data mining exercises can be described as top-down if the goal is to develop and tune an operational algorithm, or bottom-up if the goal is to discover patterns. They are said to be unsupervised if algorithms are applied blindly where investigators don’t know what they’re looking for, to see if any obvious patterns emerge. They are said the be supervised when techniques are applied to see if they turn up or confirm something specific.
This figure from my friend Richard Frederick shows these techniques in a range of increasing power and maturity. Different organizations and processes fall all along this progression.
Data comes from many sources. I describe processes of discovery and data collection in the conceptual modeling phase of my analytic framework, but data collection occurs in many other contexts as well, most notably in the operation of deployed systems. Forensic, one-off, and special investigations will tend to run as standalone efforts (possibly using my framework). Mature, deployed systems, by contrast, will collect, collate, and archive data that are processed on an ongoing basis. Development and tuning of a data mining process will be conducted on a project basis, and it will thereafter be used on an operational basis.
Development and deployment of a data mining process needs to follows these steps (per the BABOK).
- Requirements Elicitation: This is where the problem to be solved (or the decision to be made) and the approach to be taken are identified.
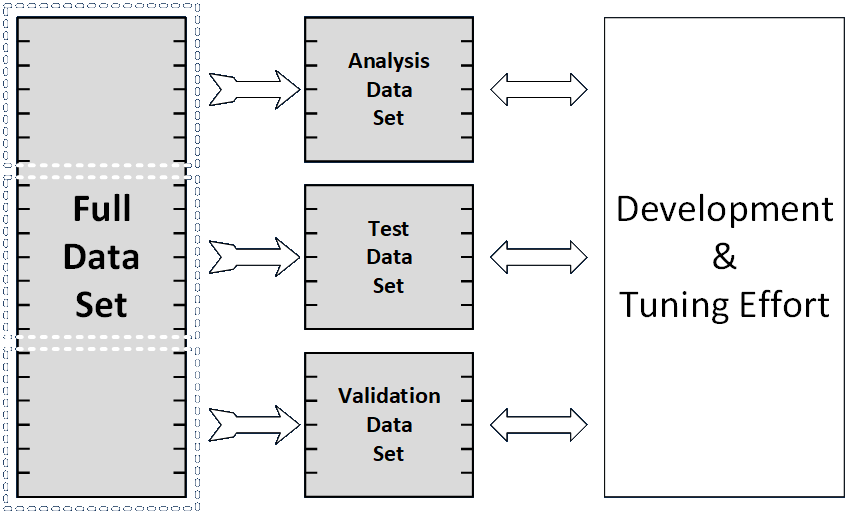
- Data Preparation: Analytical Dataset: This involves collecting, collating, and conditioning the data. If the goal is to develop and tune a specific operational algorithm, then the data has to be divided into three independent segments. One is used for the initial analysis, another is used for testing, and the other for final confirmation.
- Data Analysis: This is where most of the creative analytical work is performed. Analyses can be performed to identify the optimal values for every governing parameter, both individually and in combination with others.
- Modeling Techniques: A wide variety of algorithms and techniques may be applied. Many may be tried in a single analysis in order to identify the best model for deployment. Such techniques range from simple (e.g., liner regression) to very complex (e.g., neural networks), and care should be taken to ensure that the algorithms and underlying mathematics are well understood by a sufficient number of participants and stakeholders.
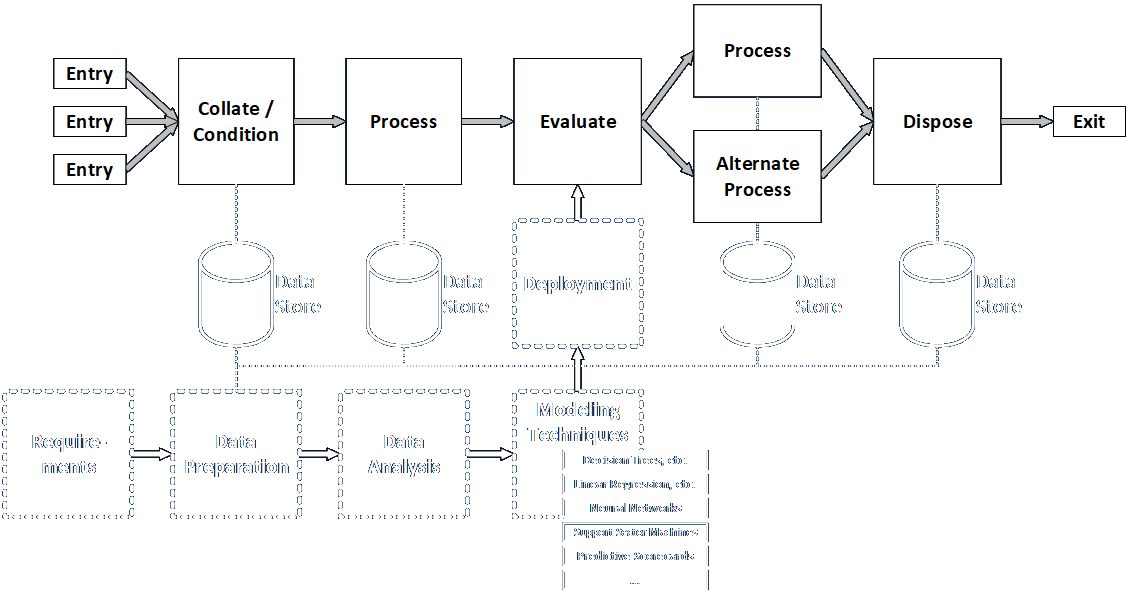
- Deployment: The developed and tuned algorithms must be integrated into the deployed system so that they absorb and process operational data and produce actionable output. They can be implemented in any language or tool appropriate to the task. Some languages are preferred for this work, but anything can be used for compatibility with the rest of the system if desired.
The figure below shows how a data mining exercise could lead to development and tuning of an analytical capability meant to support some kind of decision, based on operational data from an existing system. It further suggests how the developed and tuned capability could be deployed to the operational system as an integrated part of its ongoing function.
There are many ways data can be mined. Let’s look at some in order of increasing complexity.
- Regression and Curve-Fitting: These techniques allow analysts to interpolate and extrapolate based on fairly straightforward, essentially one-dimensional or two-dimensional data. For example, the number of customers served at a location may be predicted using a linear extrapolation derived from the number served from some number of prior time periods.
- Correlations and Associations: These allow analysts to understand whether a cause-and-effect relationship exists (with the proviso that correlation is not necessarily causation) or whether potential affinities (if customers like A they might like B and C), based on potentially many parallel streams of data.
- Neural Nets and Deep Learning: These techniques allow systems to learn to sense, separate, and recognize objects and concepts based on dense but coherent streams of data. Examples include classifying sounds by frequency (different from simple high- and low-pass filters) and identifying objects in an image.
- Semantic Processing: This involves associating data from many disparate sources based on commonalities like location, group membership, behaviors, and so on.
- Operations Research Simulations: These potentially complex systems can help analysts design and size systems to provide a set level of service in a specified percentage of situations. For example, it may be enough to design a system that will result in serving customers with no more than a twenty-minute wait eighty percent of the time, on the theory that building a system with enough extra capacity to ensure waits are less than twenty minutes in all cases would be both expensive and wasteful.
Considering this from a different angle, let us look at a maintenance process. We might examine data to determine which parts fail most often so we can improve them or keep more replacements on hand. We might see whether we can extend the time between scheduled maintenance events without incurring more failures. Data from a series of real-time sensor systems installed on a machine, in conjunction with historical data, might be able to warn of impending failure so operations can be halted and repairs effected before a major failure occurs. Numerous sources of data can be scanned to identify issues not seen via other means (social media discussions of certain vehicles, sales of consumables by season, rescue calls concentrated in certain regions, locations, or environments).
Numerous resources provide additional information, including this Wikipedia entry.