
A mind map is a particular type of diagram used for taking notes, organizing thoughts, and understanding hierarchies. Business analysts can use any type of diagram that aids understanding and communication between participants in any engagement. (My website is littered with different kinds of diagrams.)
Mind maps, however, are a very specific type of diagram. It is essentially a tree diagram that tends to be laid out in a radial pattern. These diagrams can incorporate many elements and variations to enhance clarity and information content, including colors, images, shapes, text formats, line styles and thicknesses, and probably more. The Wikipedia article on the subject includes many examples, plus additional history and background. A salient feature of a mind map is that it cannot have any cross-links. Diagrams that include those (and other features) are often referred to as concept maps.
Numerous software applications for drawing and editing mind maps exist for a variety of environments and devices.
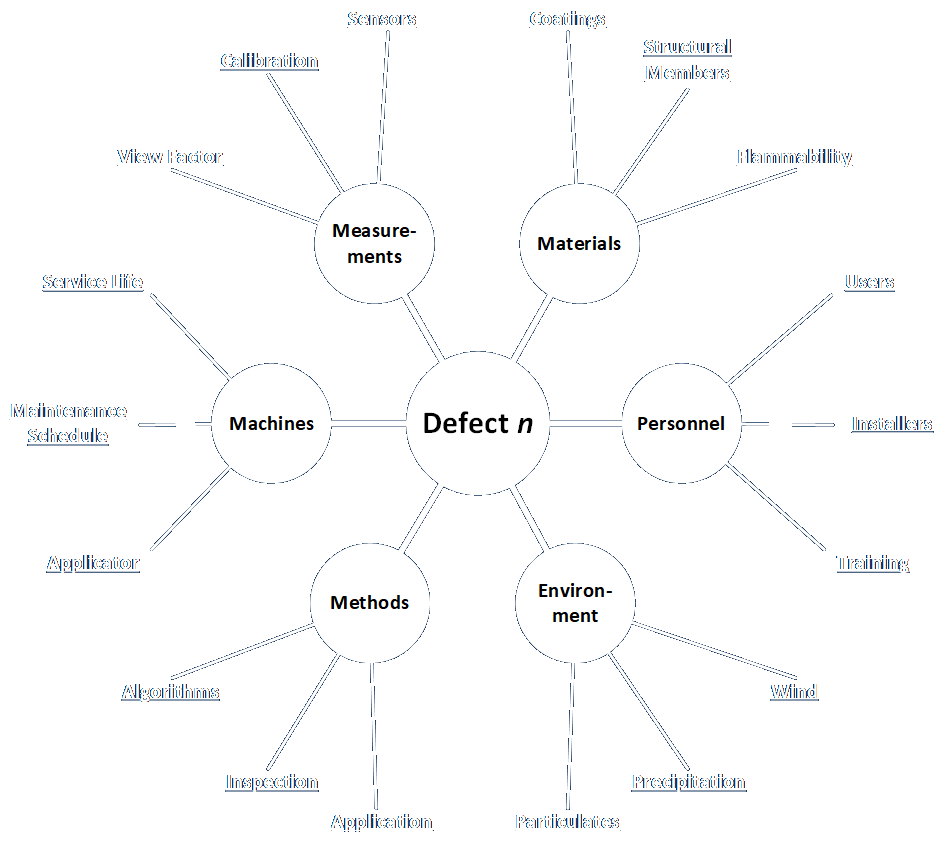
Many diagram types can be formatted as mind maps, as in the following example.
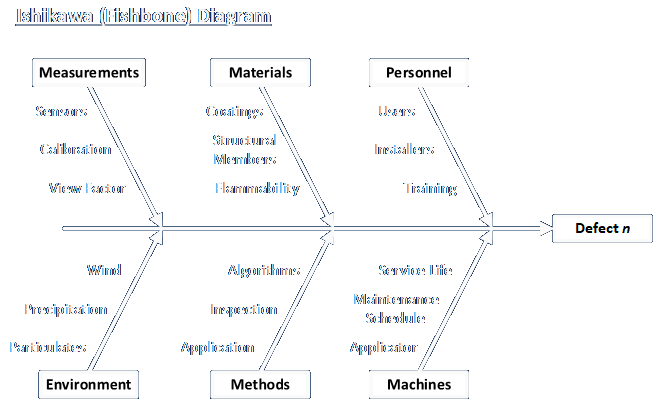
Fishbone diagram recast as a mind map:
I first encountered mind mapping techniques when I worked with a PhD principal investigator at one of the national labs around 2007 or so. As someone who prefers using unlined paper for taking notes, as a way to remove constraints on where and what type of information (text, diagrams, tables, relationship links) can be included, I was naturally curious about the idea. But, I have never been sufficiently curious to actually use any example of it.
Studies of the effectiveness of the technique seem to indicate that it doesn’t bring major benefits in certain note-taking situations, but any techniques that work for any person should be used. And, as the examples in the Wikipedia article demonstrate, they sure can make some pretty pictures!