As I’ve been pondering different aspects of my engagement framework, the management environments I’ve experienced, and the nature of the solutions I’ve helped create or that I’ve learned about through other means, it occurs to me that potential solutions are driven by a number of factors. Solutions come in many contexts, so let’s look at some of the considerations. I don’t know if any overarching classification exists, so we’ll just list what we can and see if some kind of order or hierarchy suggests itself.
- Internal vs. external customers: How a solution is approached may differ based on whether the solution team is serving an internal or external customer. External customers must be engaged on a more formal and structured basis, with the activities and behaviors often driven by contractual terms of various kinds. Internal customers are much more likely to be served with ad hoc solutions as opposed to more standardized solutions that may be the raison d’être of an organization serving primarily external customers.
- Standard solution vs. open-ended solution: Most of the companies I worked for were smaller, specialized, highly technical organizations serving larger, commercial firms with somewhat standardized solutions in a vendor or consultative capacity. None of the vendors or consultancies I worked for provided truly standardized solutions. What they did was provide solutions using a certain set of tools, components, and approaches, as opposed to going in cold and trying to generate solutions from a completely (open-ended) blank slate. The solutions were always highly customized to the customers’ specific needs and situations. I think the differentiation here has to do with the degree to which the possible solution space is constrained. (The more an organization’s solution offerings are constrained, the more I tend to refer to them as hammer-and-nail companies, because if all you have is a hammer, everything looks like a nail.) That said, the range of provided solutions from a single vendor may be quite wide, but they will all tend to be related to a single area of endeavor. For example, I worked for two different companies that provided customized, turnkey production lines (or parts thereof) to industrial clients in the paper and metals industries. Both sold systems, individual pieces of equipment, service, electronic control systems, and independent analytical services for individual situations. However, they almost always related to each other in the knowledge and process areas addressed. By contrast, I know of other consultants or vendors that provide more generalized, open-ended kinds of services. I guess it’s just a matter of how the various offerings are related. Finally, constraints may take many forms. Companies like IBM will tend to serve larger organizations that can afford to pay high rates for large, complex solutions, and providers tend to scale down from there. Every organization offering solutions is constrained in some way.
- Imposed by competition: There are a lot of reasons organizations will seek solutions, but the primary one is competition. An organization seeks and applies solutions to improve its processes and offerings on an ongoing basis, or it may (will!) suddenly find itself losing money as competitors do so and end up serving customers better. Individuals and organizations should always be looking to continually improve every aspect of their business.
- Opportunity from new technology: The appearance of new technologies can lead to all sorts of opportunities for improvement. Some will be blindingly obvious, while others may require more thought or lateral association, or even luck. I once created a really fun and successful solution based on an item I had recently seen that was new to me. That set off a whole chain of events that led to a pretty spectacular outcome. By contrast, and I intend to write about this more in the near future, some solutions and methodologies are well understood, but await a breakthrough that makes their implementation possible. The design of the Polaris missile and the submarines that launched them, for example, allocated certain volumes for various electronic systems to be housed, that couldn’t actually fit in the spaces provided. The project managers counted on improvements in technology during the development process to make everything work. Similarly, the mathematical techniques for performing certain physics and Monte Carlo analyses (using continuous and discrete-event simulation techniques, respectively) were long known but awaited the development of digital computers to finally make their applications practical.
- Automation: Automation is the process of using machines (including computers) to perform or at least assist with operations that were once done manually. I often built tools to automate calculations and even write code and documentation that would have been extremely tedious to write out or even type by hand. Similarly, I used to analyze business processes so they could use scanned images of documents instead of the paper documents themselves. The goal in those instances was to preserve the operations where humans had to apply their expertise and reasoning power in creative ways, and automate the repetitive actions the computer could be instructed to do from context. We added scanning, indexing, and archiving steps to an existing, complex business process for about ten percent of the original operating cost, and were able to automate away thirty to forty percent of the operating cost, for a savings of twenty to thirty percent overall, in addition to the elimination of a lot of human drudgery.
- Standardization / Modularization: I must have played with almost every modular construction toy in existence growing up, so I was used to putting creative things together out of standard components from an early age. The trick to doing this as a professional analyst and designer is to recognize opportunities for creating standard components. One way to do this is by using affinity grouping (think of the exercise where you brainstorm a bunch of ideas on Post-It notes and then group them by how similar certain ones are to each other). Another way is simply to recognize when you are doing the same or very similar things over and over in different situations. Standardization can be accomplished in a number of different ways. Policies and procedures can be established that enforce consistent best practices. Or, reusable (physical or logical) components can be built that enforce standard approaches or operations for any system in which they are incorporated. It is sometimes a good idea to make the created standard components configurable, so they may be adapted to individual situations as needed. In that case, designers and users need to continually reevaluate the boundary between making something configurable and when it would be best to create a new standard component.
- Rearrangement or streamlining: Sometimes all the right things are done for the right reasons and with the right operations, and all that is needed is to put them in a different order so they can be accomplished more quickly and efficiently. A classic case of this is when a series of production machines are located far apart from each other, necessitating a lot of transport time and resources between operations. If the production operations are all relocated to be near each other and in the correct order, the waste associated with transport and storage can be reduced or eliminated, making the overall process more efficient. More complex examples of this are possible. It may, for example, improve overall efficiency (and quality) to add a step to a process which performs a kind of standardized preparation and setup, so the value-added operations can be performed more cleanly and effectively, with less chance of error or unexpected occurrence. Another way to realize improvements is to re-route items so they interfere with each other less, and still another way is to relocate or otherwise automate certain operations. The latter approach may not lessen the amount of effort involved in completing some operations (for example, processing paperwork for import brokers in cross-border trucking operations), but will generate benefits in other locations (by reducing or eliminating certain sources of congestion at the border-crossing facilities themselves. In these cases, it’s all about eliminating constraints wherever possible (and then identifying and addressing whatever becomes the new constraint…).
- Lean vs. Six Sigma: Lean is doing more or the same with less, while Six Sigma is about eliminating variability (and hence waste) so you effectively do more with the same. Tightening up a machine or creating a jig or structuring a computer’s user interface to improve clarity and situational awareness leading to a reduction in errors and thus loss or rework is what Six Sigma is all about. Lean is about automation, standardization, and rearrangement or streamlining as described directly above.
- Profiling (Theory of Constraints): Software developers often instrument their code to see which operations are taking the most time (or consuming the most memory or bandwidth or other relevant resource) in order to identify which code to devote time toward making more efficient. (I have written about extreme loop unrolling in some of my own work, for example.) Code profilers have been around for a long time. A number of standard techniques exist to improve the speed (and other consumption of resources) of code, and a balance must be struck between the efficiencies to be gained vs. the cost to gain them. However, this approach is applicable to far more activities than computer code. A couple of years ago I listened with interest as a very successful entrepreneur described how he noticed that his biggest expense for a particular product was in the materials used to build them. The entrepreneur then asked an expert in that class of materials if anything cheaper existed that would do the same job at a lower cost. Upon learning that the answer was yes, the entrepreneur adopted the new material, thus lowering costs significantly while retaining quality, durability, and performance. As discussed above, this is just another exploration of the Theory of Constraints.
- Simplification: Making products simpler can make them easier to use and easier to produce. Product lines can be extended with simpler options (which may or may not be desired). Design for manufacturability is a major practice in this area. I’ve watched certain products I use be continuously redesigned so they embody simpler shapes and include fewer parts. It can take a lot of experience and insight to see how to make something simpler. One doesn’t generally find the simplest, most optimal design on the first try. It takes iteration to get something to work and then successively improve it. In a market sense, it is sometimes less a case of “getting there first-est with the most-est” (as they say about wars) than about “getting there first-est with just-enough-est.”
- Incremental vs. The Big Kill: Many kinds of improvements are possible. Sometimes it is necessary to make a lot of small improvements to eliminate losses and small errors, and sometimes it is possible — and even necessary — to do something completely new or different and make a major improvement in one quantum leap. Individuals and organizations should continually look for ways to do both.
- End-of-Life, replacement, and repurposing: Change is sometimes necessitated by circumstance. One possible example is that existing capabilities stop functioning due to failures, and another example is that the vendor of the capability goes out of business or otherwise withdraws support (think versions of software, fixed-duration warranties, exhaustion of spare parts, and more). In these cases, the user is driven to adopt a new solution or abandon that capability entirely. It is also possible that a capability that becomes uneconomic for its original use can be repurposed for an alternative use where the economics make sense. When I worked in the paper industry in the late-80s, the major emphasis and source of market growth was newsprint (my, how things have changed!). When modern production lines are turning out bright, strong rolls of paper, forty feet wide at sixty miles an hour, it can be impossible to run older production lines at a profit. However, it was often possible to repurpose a line, with minimal tooling and rework, to instead produce specialty grades of paper (like tissue) in a way that could still be profitable. I also heard of entire lines being purchased to be shipped to developing countries for greatly reduced capital outlay (vs. a new system), so that it made economic sense to operate there. Much of this discussion is probably more germane to the use of capital equipment rather than software, but readers should be alert to all relevant possibilities.
- Entirely new solutions (market opportunities from both growth and development): Sometimes the opportunity to be exploited isn’t in doing the same thing better, but in doing something entirely new. These opportunities may be driven by technology, as described above, but may also be driven by economic growth, changing tastes or practices, or other reasons. “New” can mean a number of things in this context. New can mean doing more of the same things (increasing scale), and also can mean doing more different things (increasing scope). Writer Jane Jacobs, the noted urban theorist (among other things), differentiated between growth and development along these lines. Another form of new can mean moving to new locations, whether adding to the total stock of capability, or replacing capability lost elsewhere. However it is defined, doing new things is going to be different than improving existing things.
- Improved management techniques: This type of improvement can take many forms. It is subsumed in a lot of the other items described above, but I will add a couple more here as a kind of a catch-all. One possible management improvement is in how maintenance is conducted. Collecting new data or leveraging existing data can allow organizations to implement or fine tune preventive or condition-based maintenance procedures to head off major failures, improve uptime, and reduce overall maintenance costs and materials. Other benefits to be realized include employee and customer support and engagement, improved communications of various kinds, improved training to make the workforce more aware of all of the foregoing, and more.
- General technical solutions: There are large classes of problems that may be addressed in fairly standard ways, all of which can provide or improve value when judiciously applied. I wrote this article in response to an interesting presentation I saw a few years ago on the ARIZ (formerly TRIZ) method. Sometimes, of course, there are no solutions, only trade-offs. Many solutions that come out of the practice of ARIZ overlap with items discussed previously in this article.
So, that’s everything I can think of the time being. Can you think of anything I might add? I’d love to hear your suggestions.
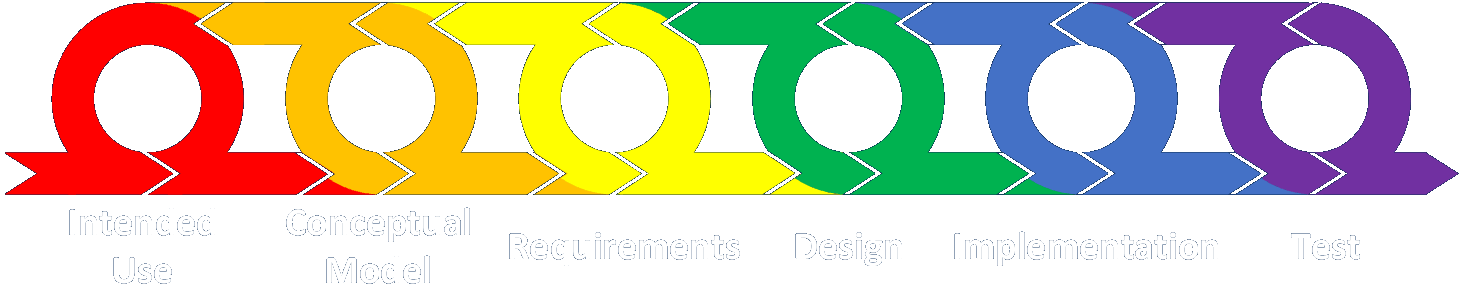
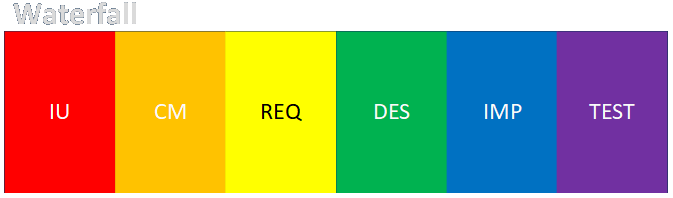
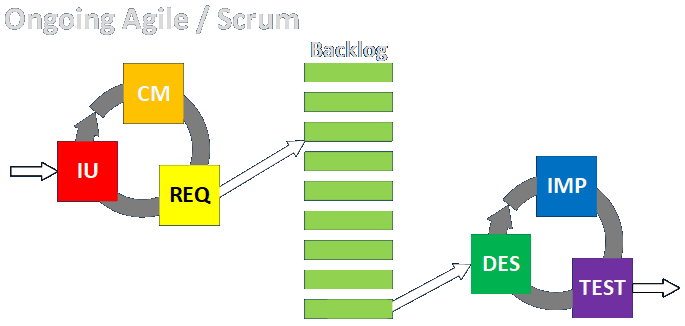
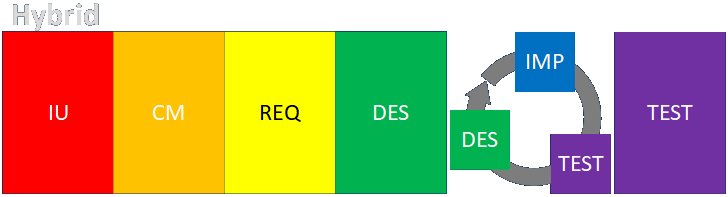
 Intended Use
 Conceptual Model (As-Is State)
 Data Sources, Collection, and Conditioning
 Requirements (To-Be State: Abstract)
 Design (To-Be State: Detailed)
 Implementation
 Test
Test Operation and Maintenance
 End-of-Life and Replacement