Mind Mapping

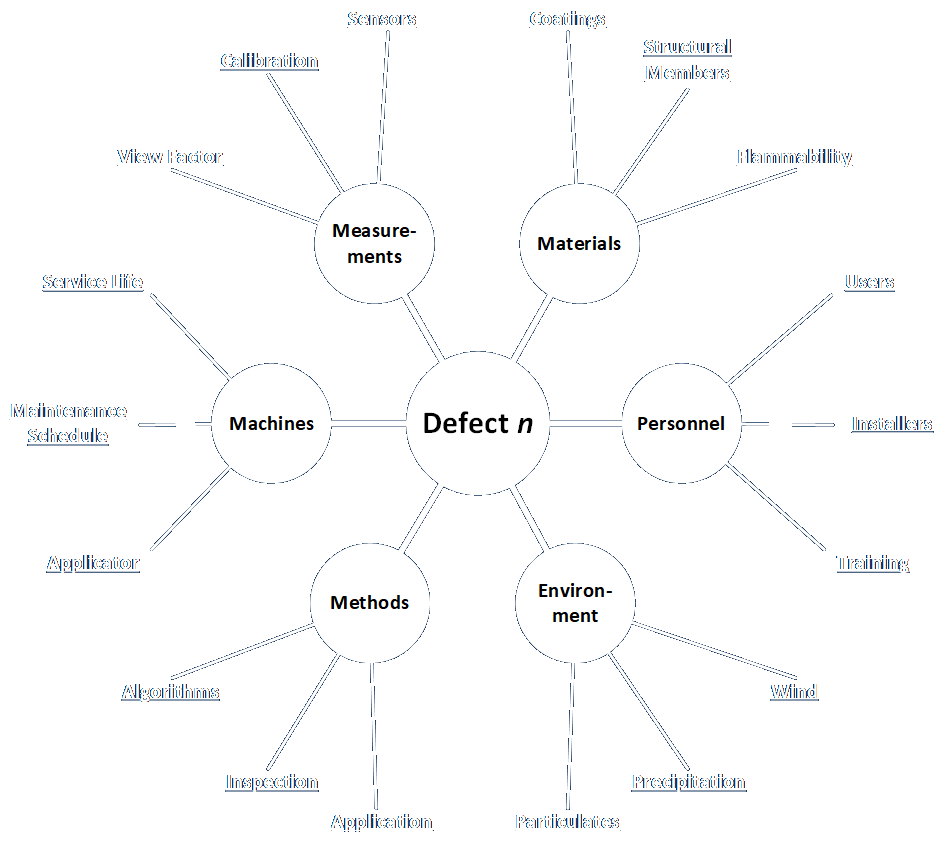
A mind map is a particular type of diagram used for taking notes, organizing thoughts, and understanding hierarchies. Business analysts can use any type of diagram that aids understanding and communication between participants in any engagement. (My website is littered with different kinds of diagrams.)

Mind maps, however, are a very specific type of diagram. It is essentially a tree diagram that tends to be laid out in a radial pattern. These diagrams can incorporate many elements and variations to enhance clarity and information content, including colors, images, shapes, text formats, line styles and thicknesses, and probably more. The Wikipedia article on the subject includes many examples, plus additional history and background. A salient feature of a mind map is that it cannot have any cross-links. Diagrams that include those (and other features) are often referred to as concept maps.

Numerous software applications for drawing and editing mind maps exist for a variety of environments and devices.

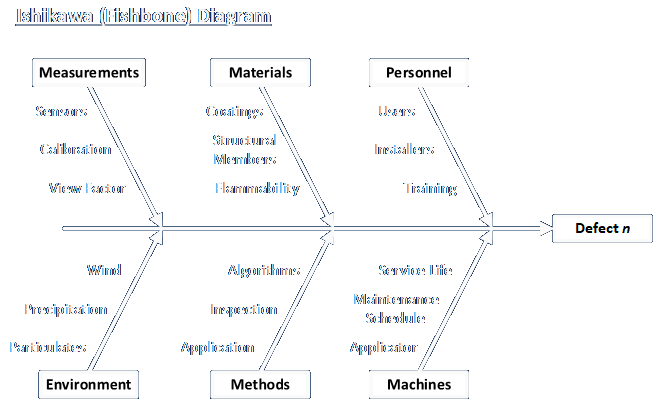
Many diagram types can be formatted as mind maps, as in the following example.

Fishbone diagram recast as a mind map:

I first encountered mind mapping techniques when I worked with a PhD principal investigator at one of the national labs around 2007 or so. As someone who prefers using unlined paper for taking notes, as a way to remove constraints on where and what type of information (text, diagrams, tables, relationship links) can be included, I was naturally curious about the idea. But, I have never been sufficiently curious to actually use any example of it.

Studies of the effectiveness of the technique seem to indicate that it doesn’t bring major benefits in certain note-taking situations, but any techniques that work for any person should be used. And, as the examples in the Wikipedia article demonstrate, they sure can make some pretty pictures!

Posted in Tools and methods | Tagged , , , | Leave a comment

Functional Decomposition

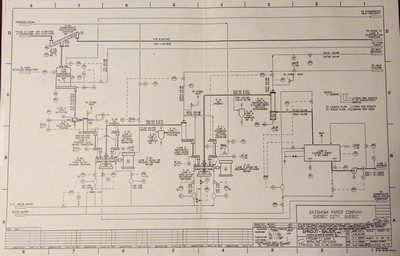
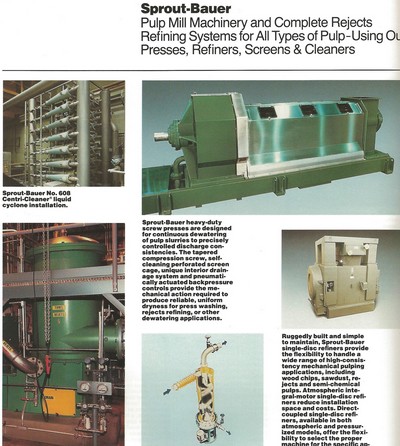
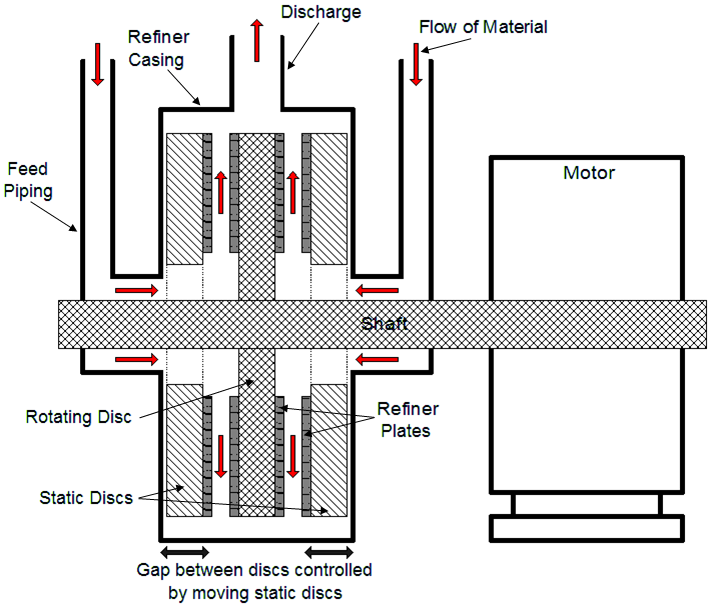
My first engineering job was as a process engineer in the paper industry, where I designed and analyzed large industrial systems that ran this…

through this…

to make this…

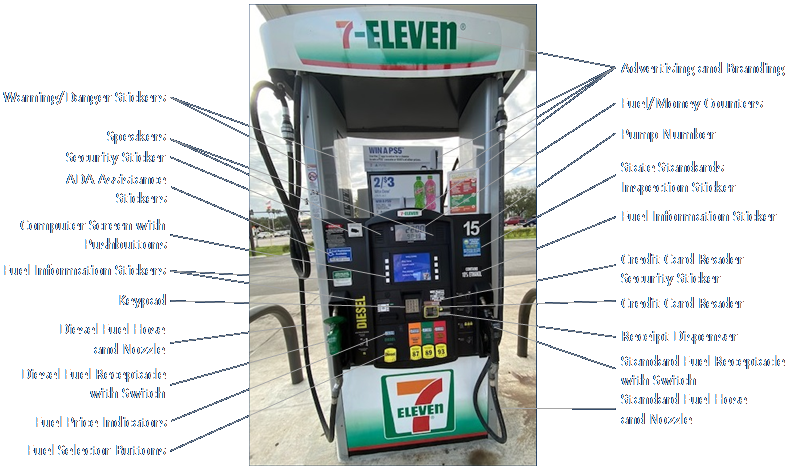
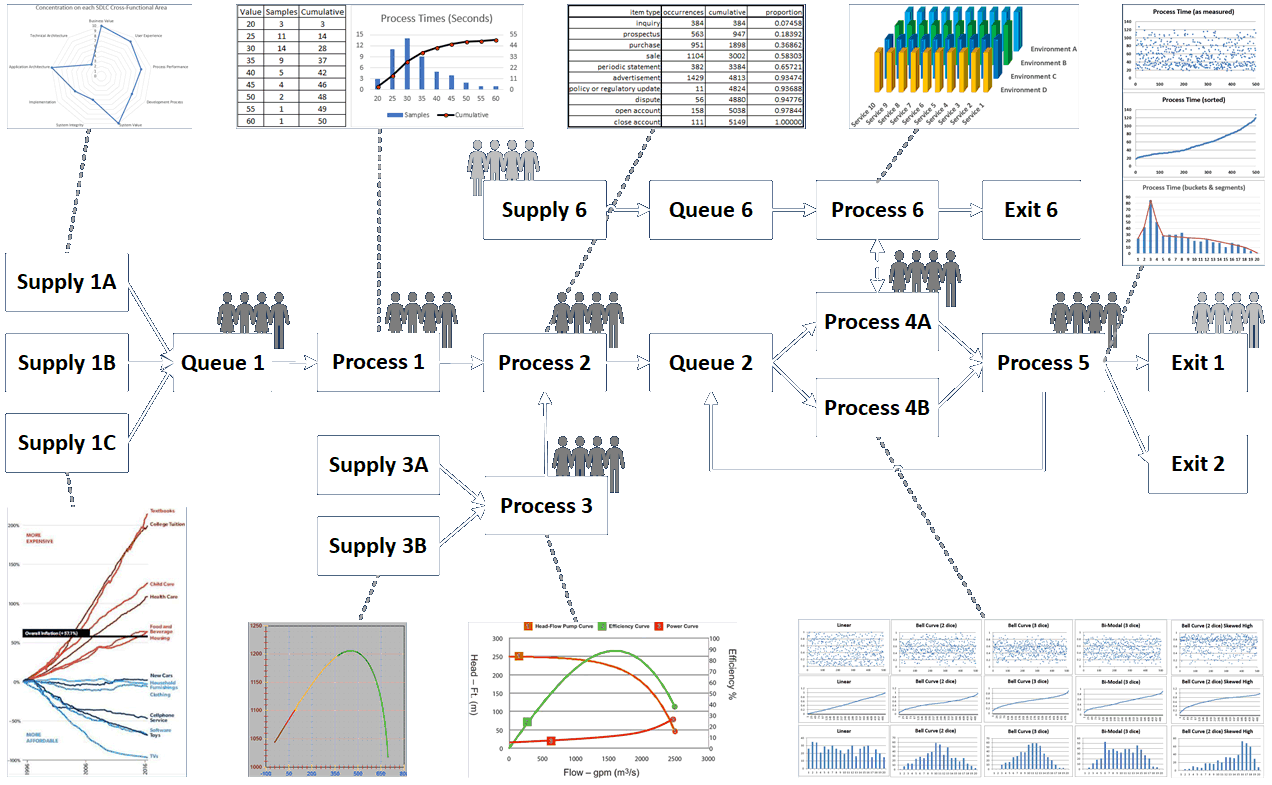
We can break the system down (or build it up) like this…

using components like this…

and this…

which can further be broken down like this…

…into as much detail as you’d like to get into.

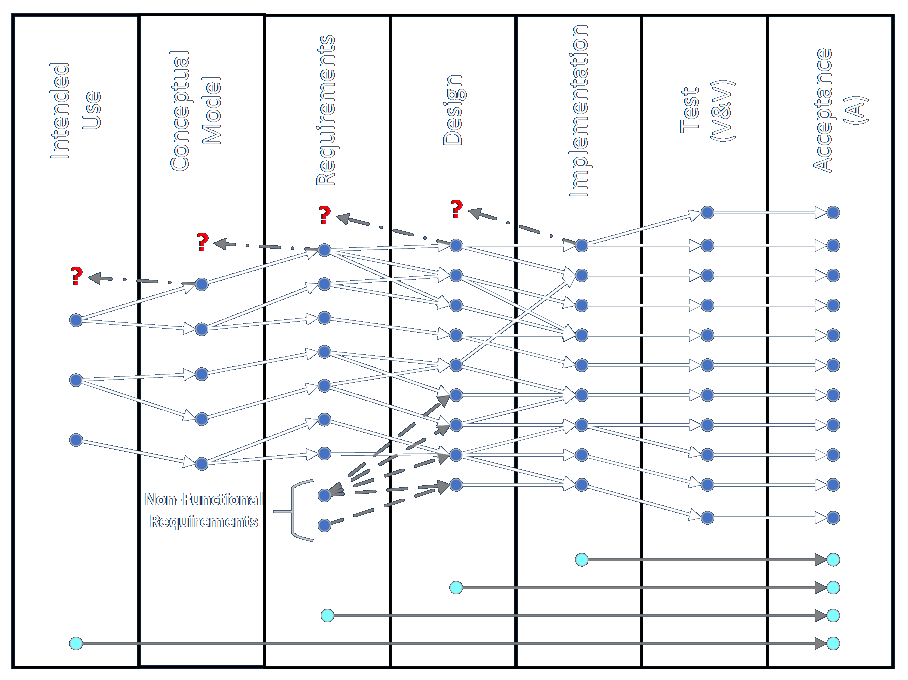
When tracking items through an engagement…

they can be decomposed as requirements are more elaborated and defined.

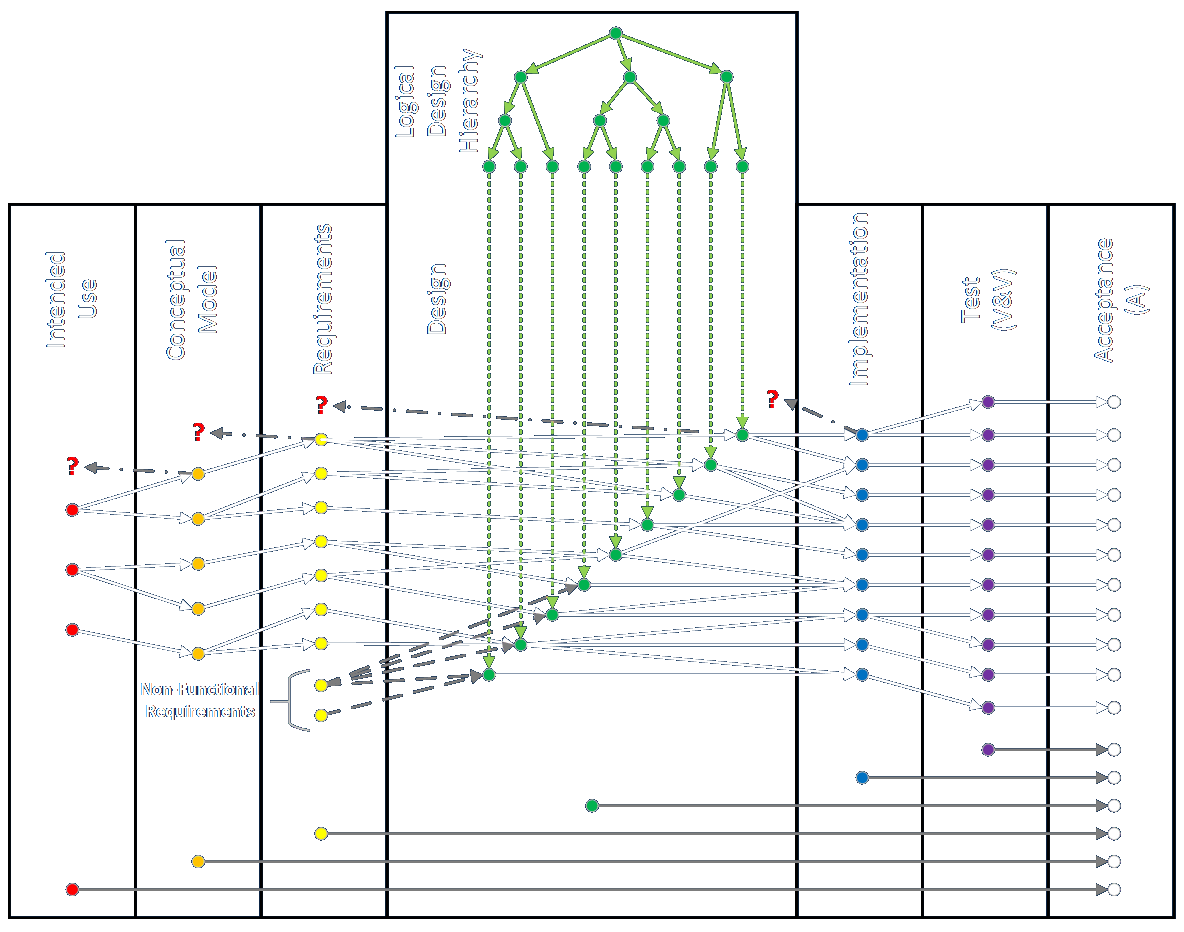
Remember that RTMs must crosslink horizontally across phases and vertically to define the logical, hierarchical relationships of the solution elements.

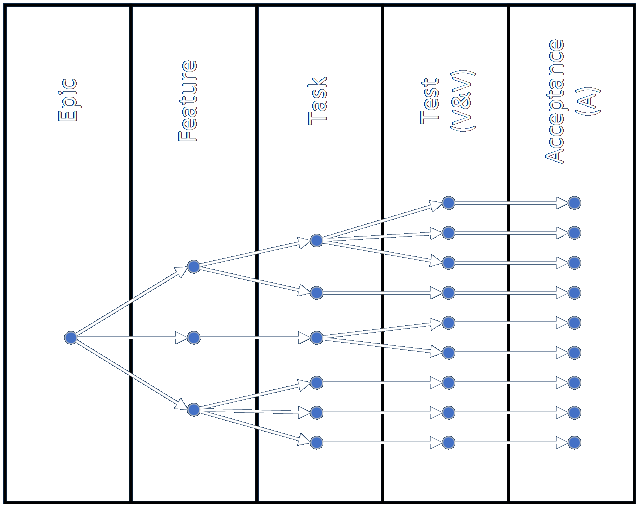
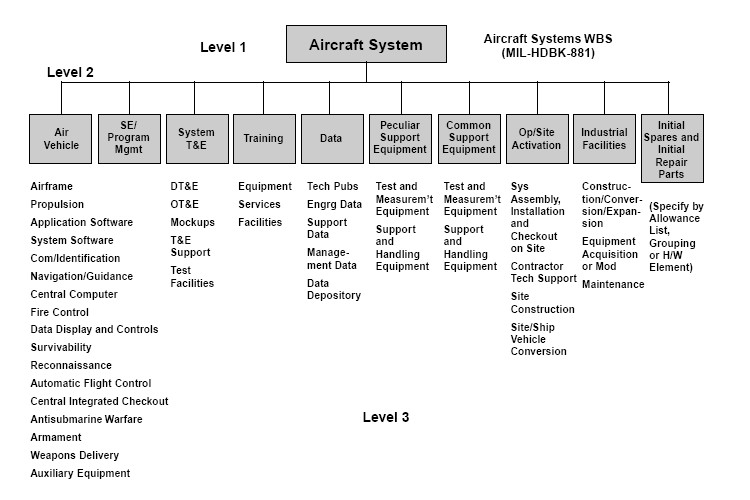
Here is a high level example of a hierarchical breakdown of a large system. Imagine this being rotated ninety degrees counter-clockwise and plotted vertically in the RTM shown above.

These two views can be merged as follows. (See full discussion here.)

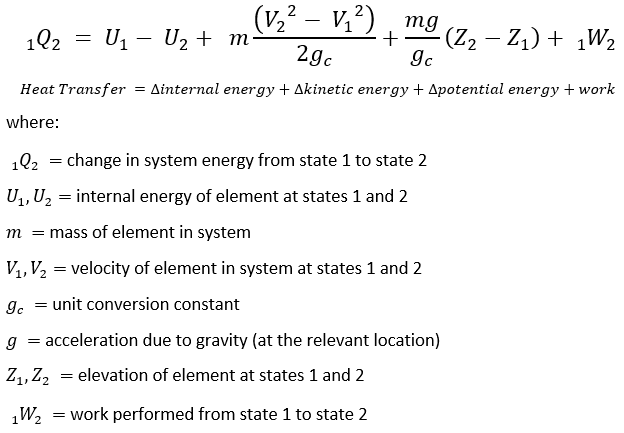
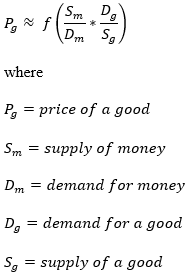
If a system can be described by known equations, each term can be analyzed in terms of identifying every possible effect that could make any individual variable larger or smaller, and also considering terms that may drop out entirely. The first equation is explicit and formal while the latter serves as more of a mnemonic.

This diagram shows the flow of calculations in a large spreadsheet, which is just another form of very long equation.

Behaviors and decisions can be analyzed down to very low levels.

Process models can be analyzed from the top down…

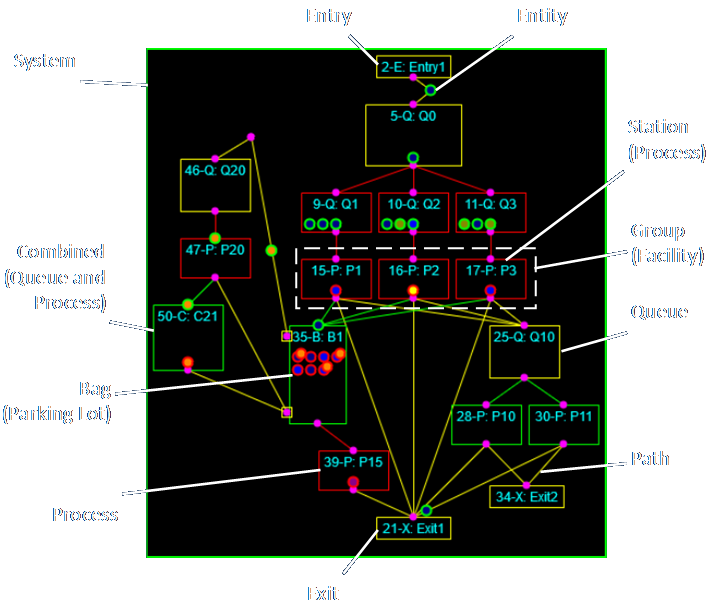
and from the bottom up. Multiple operations can take place within a location, station, or subprocess…

and those can be broken down in exacting detail.

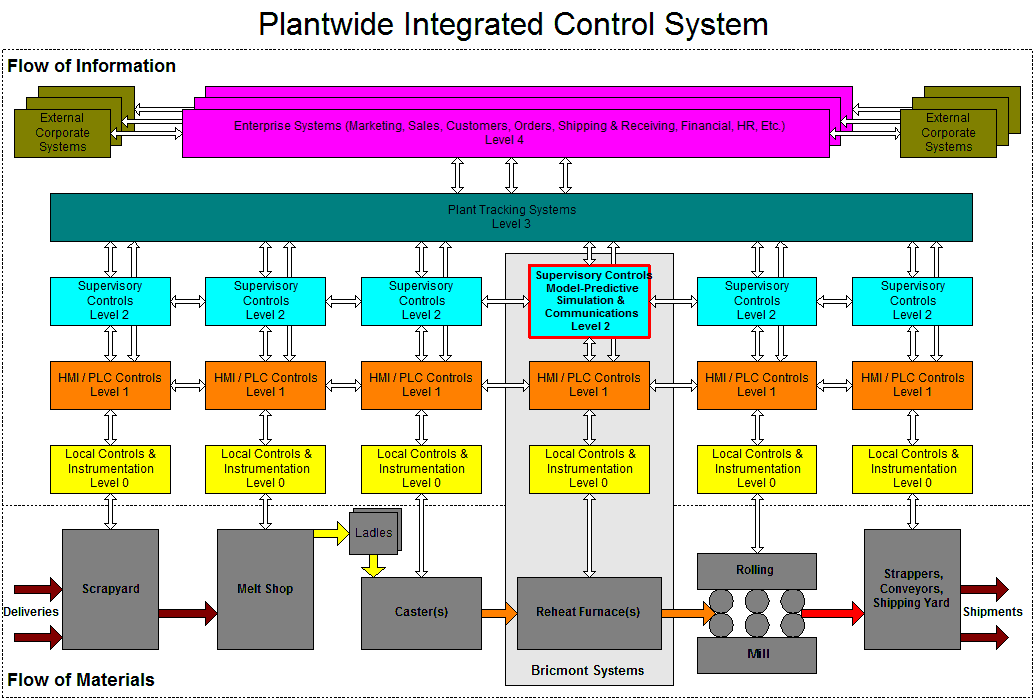
Large systems can be broken down to understand contexts and details. Each element in the diagram below is its own, highly complex entity involving the work of multiple creators and integration of a myriad of materials and technologies.

Analyzing all aspects of a systemic capability, potentially across multiple products, can highlight commonalities and differences, and can help identify opportunities to plug gaps, regularize techniques, increase modularization, and so on.

This type of diagram is a common tool to perform root cause analysis. The categories of the “ribs” could be remembered using 5 Ms and an E.

Employing many different modes of decomposition gives many possible perspectives and insights. This helps ensure that analyses will be thorough and robust.

The BABOK identifies the following categorizations on the subject, many of which are discussed above. Please consult the relevant section of the BABOK for further details.

  1. Decomposition Objectives
    • Measuring and Managing
    • Designing
    • Analyzing
    • Estimating and Forecasting
    • Reusing
    • Optimization
    • Substitution
    • Encapsulation
  2. Subjects of Decomposition
    • Business Outcomes
    • Work to be Done
    • Business Process
    • Function
    • Business Unit
    • Solution Component
    • Activity
    • Products and Services
    • Decisions
  3. Level of Decomposition
    • Per the examples above, decomposition can continue down through as many levels as make sense for a given analysis.
  4. Representation of Decomposition Results
    • Tree diagrams
    • Nested diagrams
    • Use Case diagrams
    • Flow diagrams
    • State Transition diagrams
    • Cause-Effect diagrams
    • Decision Trees
    • Mind Maps
    • Component diagram
    • Decision Model and Notation
Posted in Tools and methods | Tagged , , | Leave a comment

Data Modeling

From the BABOK:

A data model describes the entities, classes or data objects relevant to a domain, the attributes that are used to describe them, and the relationships among them to provide a common set of semantics for analysis and implementation.

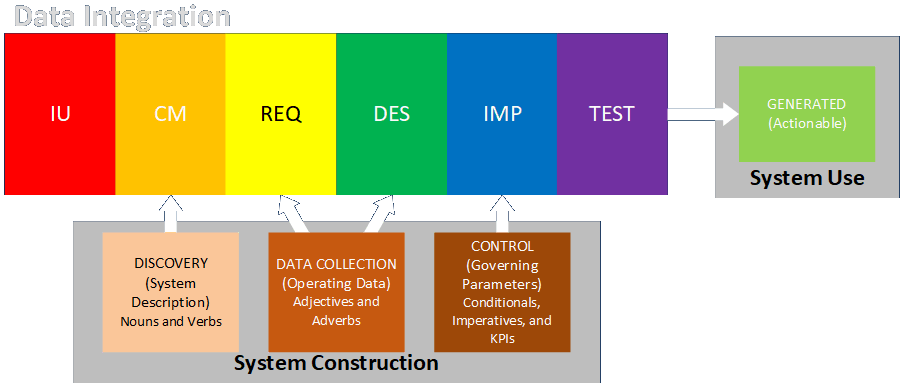
I’ve written about data in many contexts, but I usually start by pointing out that data is identified through the processes of discovery, which identifies the nouns and verbs of a process (the BABOK refers to these as entities), and data collection, which describes the adjectives and adverbs of a process (the BABOK refers to these as attributes). The BABOK further describes relationships or associations between entities and attributes (entities-attributes, entities-entities, attributes-attributes). Finally, this information is often represented in the form of diagrams.

Different types of data models are generated during different phases of an engagement (per my six-phase, iterative framework).

The conceptual data model is created during the conceptual model phase (oooh, there’s a shock!). This shows how the business thinks of its data, and these diagrams are produced as the result of the discovery and data collection processes mentioned above. This work may be folded into other phases if the engagement is meant to build something new, as opposed to modifying (or simulating) something that already exists.

The logical data model is typically developed during the requirements and design phases. This is an extension or abstraction of the conceptual data model that describes the relationships and rules for normalization that help govern and ensure the integrity of the data representation.

The physical data model is defined during the implementation phase. This shows how the data is physically and logically arranged in memory, files structures, databases, and so on.

There are many ways to list and describe data in diagrams.

This diagram shows the nouns and some implied verbs of a system, sometimes using slightly different verbiage.

Here is a representation of the attributes associated with each identified entity.

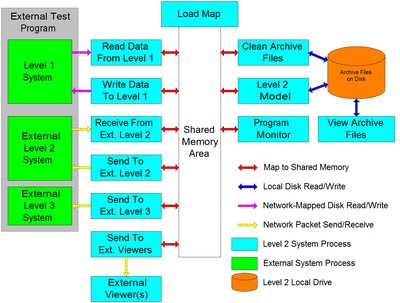
Here is a simple representation of the physical location of data in an implemented system.

The header listing below shows a detailed description of the shared memory area from the diagram above.

Here is a more complicated and explicit representation of data in a database.

image linked from a paper on researchgate.net, ma be subject to copyright

The BABOK describes two specific types of diagrams, an Entity-Relationship Diagram using Crow’s Foot notation, and a Class Diagram from UML. I recommend researching these two types of diagrams as questions about them may arise on the CBAP exam and other exams.

Posted in Tools and methods | Tagged , , , | Leave a comment

Prototyping

This BABOK technique involves creating something that allows investigation of one or more aspects of the solution being developed. This creation can be physical, in the case of mock-ups meant to illustrate a concept or explore ergonomics or test a subsystem or plan manufacturability, or abstract, in the case of diagrams or storyboards or process descriptions or user interface designs.

Prototypes can be produced as throw-aways, which means they are only temporary creations. How many ventures started from drawing on a napkin in a restaurant? They can be functional, which means they actually perform at least some aspect of the end solution. Many famous examples of these can be found in museums, up to complete experimental aircraft. A series of prototypes can be created as the proposed design evolves over multiple iterations. Think of all the prototypes made to test the thousands of items needed for the moon landings.

They can be used to demonstrate a proof of principle or proof of concept. These are created to explore the new applications of tools, technologies, discoveries, or arrangements. Sometimes the tools or technologies are being used for the first time by anyone, but usually they are just used by teams to test fitness for the present purpose, or to demonstrate that the team can use them. A coworker of mine built a mock-up of a novel walking mechanism for a steel reheat furnace — out of cardboard, pipe cleaners, and toothpicks. It allowed all viewers to quickly grasp its simplicity. Moving the walking carriage by hand inside the outer shell clearly demonstrated that a simple mechanical movement could robustly and reliably achieve the desired results in a harsh industrial environment.

Prototypes can be created to explore the usability of solutions by their intended customers, including of software GUIs and physical interfaces on things like consumer electronics. GUI mock-ups can be created with varying degrees of functionality and visual appeal using tools like rapid builders (Borland’s GUI tools were terrific for this), Balsamiq, Visio, or whiteboard drawings. The original computer mouse was made of wood.

Some prototypes test the visual aspects of a proposed solution, including color, arrangement, font size and shape, and other visual cues. Examples include signage, warning labels, product packaging, and industrial design. Some clever (read: cynical and slightly evil) manufacturers realized that making potato peelers with brown handles made users more likely to throw them away with their potato peels, so they would have to buy more more!

Functional prototypes allow testing the operation of a proposed solution in whole or in part. Think of docking ports on spacecraft, or of computer algorithms.

Models and simulations are a potentially powerful, and also potentially complex form of prototyping. One of my past companies used a version of my suggestion for its advertising slogan: “We do it a thousand times so you do it right the first time.” These can involve 3D models, process models, visual models, and so on.

Prototypes can be used in every part of the engagement and product life cycle.

Posted in Tools and methods | Tagged , , | Leave a comment

Scope Modeling

I think an argument can be made that this technique should more properly be called “scope determination” or “scope identification.” I also observe that determinations of scope happen during the conceptual modeling phase, when you discover what’s happening in an existing process, or during requirements and design, when defining aspects of the solution. However, since those can all be thought of as forms of modeling, maybe I can live with it.

I’ve discussed elements of scope determination previously (here and here). The BABOK goes into a lot of detail in its section on scope modeling, but in the end I think it really boils down to whether something is either in scope or out of scope of your work, or within one part or another of your work.

The BABOK mentions the contexts of control (who does or is responsible for what), need (who needs what), solution (what part of the system does what), and change (what does and does not change), and under relationships between logical components lists Parent-Child or Composition Subset, Function-Responsibility, Supplier-Consumer, and Cause-Effect, but I think of these as points of interface that fall out of the normal course of work. Knowing where to draw the boundaries between different components, functions, subsystems, organizations, teams, microservices, and so on is a crucial part of understanding and architecting systems.

The BABOK also lists emergent as a type of relationship, to describe the possibility that unexpected behaviors can arise from the interactions within complex systems. While this is undoubtedly true, I don’t see that it has much to do with scope.

Another aspect of scope, in my experience, has to do with the phase of assumptions, capabilities, and risks and impacts, which implicitly proceeds in conjunction with the conceptual model, requirements, and design phases. And this primarily concerns assumptions. An effect or data source may be within the accepted scope, but there may be valid reasons why you need to simplify mechanisms or assume values.

Posted in Tools and methods | Tagged , , , | Leave a comment

Data Dictionary

Maintaining a dictionary of data items is a very good idea for engagements of sufficiently wide scope and involving enough participants. This greatly simplifies and clarifies communication and mutual understanding among all participants, and should fall out of the work naturally while continuously iterating within and between phases.

Data can be classified in many different ways, and all of them can be included in the description of each data item.

The context of data (my own arbitrary term) describes the item’s conceptual place within a system. (I described this in a webinar.)

  • System Description: data that describes the physical or conceptual components of a process (tends to be low volume and describes mostly fixed characteristics)
  • Operating Data: data that describe the detailed behavior of the components of the system over time (tends to be high volume and analyzed statistically); these components include both subprocesses within the system and items that are processed by the system as they enter, move through or within, and exit the system.
  • Governing Parameters: thresholds for taking action (control setpoints, business rules, largely automated or automatable)
  • Generated Output: data produced by the system that guides business actions (KPIs, management dashboards, drives human-in-the-loop actions, not automatable)

The class of data (my own arbitrary term again) describes the nature of each data item.

  • Measure: A label for the value describing what it is or represents
  • Type of Data:
    • numeric: intensive value (temperature, velocity, rate, density – characteristic of material that doesn't depend on the amount present) vs. extensive value (quantity of energy, mass, count – characteristic of material that depends on amount present)
    • text or string value: names, addresses, descriptions, memos, IDs
    • enumerated types: color, classification, type
    • logical: yes/no, true/false
  • Continuous vs. Discrete: most numeric values are continuous but counting values, along with all non-numeric values, are discrete
  • Deterministic vs. Stochastic: values intended to represent specific states (possibly as a function of other values) vs. groups or ranges of values that represent possible random outcomes
  • Possible Range of Values: numeric ranges or defined enumerated values, along with format limitations (e.g., credit card numbers, phone numbers, postal addresses)
  • Goal Values: higher is better, lower is better, defined/nominal is better
  • Samples Required: the number of observations that should be made to obtain an accurate characterization of possible values or distributions
  • Source and Availability: where and whether the data can be obtained and whether assumptions may have to be made in its absence
  • Verification and Authority: how the data can be verified (for example, data items provided by approved individuals or organizations may be considered authoritative)
  • Relationship to Other Data Items: This involves situations where data items come in defined sets (from documents, database records, defined structures, and the like), and where there may be value dependencies between items.

It is also important to identify approaches for conditioning data. Complete data may not be available, and for good reason. Keeping records is sometimes rightly judged to be less important than accomplishing other tasks. Here are some options for dealing with missing data (from Udemy course R Programming: Advanced Analytics In R For Data Science by Kirill Eremenko):

  • Predict with 100% accuracy from accompanying information or independent research.
  • Leave record as is, e.g., if data item is not needed or if analytical method takes this into account.
  • Remove record entirely.
  • Replace with mean or median.
  • Fill in by exploring correlations and similarities.
  • Introduce dummy variable for “missingness” and see if any insights can be gleaned from that subset.

More considerations for conditioning data include:

  • Data from different sources may need to be regularized so they all have the same units, formats, and so on. (This is a big part of ETL efforts.) Note that an entire Mars probe was lost because two teams did not ensure the interface between two systems used consistent units.
  • Sanity checks should be performed for internal consistency (e.g., a month’s worth of hourly totals should match the total reported for the month).
  • Conversely, analysts should be aware that seasonality and similar effects mean subsets of larger collections of data may vary over time.
  • Data items should be reviewed to see if reporting methods or formats have changed over time.
  • Data sources should be documented for points of contact, frequency of issue, permissions and sign-offs, procedures for obtaining alternate data, and so on.
Posted in Tools and methods | Tagged , , , , | Leave a comment

Financial Analysis

Financial analysis comprises a number of considerations and methods. They all begin by assigning costs to all germane capital, fixed, and variable items in the existing state and in the future state, and also considering expected revenues. Some of the accounting is straightforward, but other analyses require time value of money (TVoM) calculations.

I often quip that my family has produced four generations of economists (or at least financial professionals) and that as a mechanical engineer and programmer I’m something of a black sheep. However, that background led me to take a course in engineering economic analysis in the spring semester of my freshman year in college, back in 1981. I also spent the following summer working as a customer service rep for a mutual fund run by my father’s company, Federated Investors.

Time value of money calculations come in many variations, but they all involve series of revenues and payments at an interest rate. One of the most important of these calculations is for present value. This is applied because (under a normal situation where interest rates are positive) money in the future is considered less valuable than money today, which is why interest rates in such calculations are called discount rates. For projects that may involve expenditures and revenues over long periods of time, these must all be converted to present values to determine whether the project makes sense. Interest rates may be different for revenues and expenditures.

Here are some specific elements that come up (many are listed in the BABOK, but not all).

Capital Costs: These are one-time costs for items needed to support the new process. They can include physical plant, machines, tools, IP licenses, software, and one-time services.

Fixed Costs: Ongoing costs that occur at regular intervals, whose magnitudes either don’t change or change at predictable rates. These can include salaries and benefits, rents, utilities, ongoing license fees, regular consumables, insurance premiums, scheduled maintenance, regulatory fees, and so on.

Variable Costs These are costs that occur at irregular intervals or that can be different over time. These can be incurred due to market and regulatory changes, natural disasters (even if covered by insurance), unscheduled maintenance, accidents, and more.

Revenues: These are the projected income amounts over future intervals of time. These can never be known for sure in advance, although estimates may be more accurate to the degree that future conditions are expected to resemble past and current conditions. Projections of future revenues are ultimately up to the entrepreneurial judgment of the owners and managers of the organization. I’ve seen such judgments be very successful and fail completely. Consider the difference between Steve Jobs’ launching of the iPhone, iPad, and Apple Watch, the demand for which could not actually be known (and also the Palm/HP Pre smartphone, which you probably don’t remember for a reason), and the decision to place a new drug store in a growing neighborhood with well-understood demographics.

Value Realization: This is essentially present value of all future forms of income, but it should also include non-financial aspects of value. Examples of the latter are improved employee engagement and morale, reliability, and organizational reputation (although economic values can be assigned to those things).

Cost of the Change: These are the transition costs associated with the installation of or transition to a new process. This is especially germane when transitioning from an existing process to a new (modified or improved) process. It isn’t really germane when a new process is being implemented when it’s not replacing an existing process.

Total Cost of Ownership (TCO): This represents the cost to acquire a solution over its entire life cycle, including capital, installation, ongoing, and retirement costs. Some solutions have a known life expectancy, but in other cases an upper limit will be placed on the duration of the analysis. If the investment doesn’t pay for itself within something like three or five years it will not be undertaken. The actual duration will depend on the nature of the investment.

Cost-Benefit Analysis: This is the present value of the projected benefits minus the present value of the present costs for the proposed endeavor. In theory the benefits will be greater than the costs. The relative cost-benefit (and risk) or pursuing different projects is a major criteria in selecting projects to execute. Efforts should be made to identify and include all relevant costs and benefits in any such analysis.

Return on Investment (ROI): This is expressed as a percentage as the benefit minus the cost over the cost or

ROI = (Total Benefits – Total Cost) / Total Cost

Net Present Value (NPV): As mentioned previously, this is expressed as the present value of the benefits minus the cost of the investment (present value of total cost).

Internal Rate of Return (IRR): This is yet another way to determine the relative worth of pursuing different projects. It is the interest rate (or the discount rate) at which the project would be expected to break event (have a NPV of zero). Projects with a higher IRR are preferred. Companies will sometimes specify a hurdle rate that represents the minimum IRR they expect to realize on an investment.

Note that the nominal interest rate is the published rate that is actually in effect (for the given situation, duration, and so on). The real interest rate is the nominal rate minus the rate of inflation. Real interest rates can be negative, which should be an unusual situation. All of the foregoing calculations should be performed using the real rate of interest, while remaining mindful that both nominal interest rates and the rate of inflation may vary, and sometimes by a lot. I lived through the double-digit interest rates of the 1970s and 80s, and many countries have experienced far higher rates over time. I suspect that we are currently moving into a period of much higher and more volatile interest rates here in the United States.

I’ve written simulations that incorporate costs and revenues for each element, that allow me to determine whether certain scenarios were supportable or were good investments. I did this while working for a customer that gave me average numbers to work with. Customers will often want to keep such information close to the vest for reasons of competitiveness and privacy, so you may need to develop tools that let then enter the correct values and run the analyses on their own.

As a final aside, some interesting work is currently being done on the origins of interest that go beyond the pure time preference of individuals.

Posted in Tools and methods | Tagged , , | Leave a comment

Lessons Learned

I’ve touched on the idea of lessons learned a few times previously, but here I’d like to address the idea directly and explicitly, as part of the Tampa IIBA’s ongoing review of the BABOK, specifically the techniques listed in chapter 10, during its weekly online certification study sessions.

Per the BABOK,

The purpose of the lessons learned process is to compile and document successes, opportunities for improvement, failures, and recommendations for improving the performance of future projects or project phases.

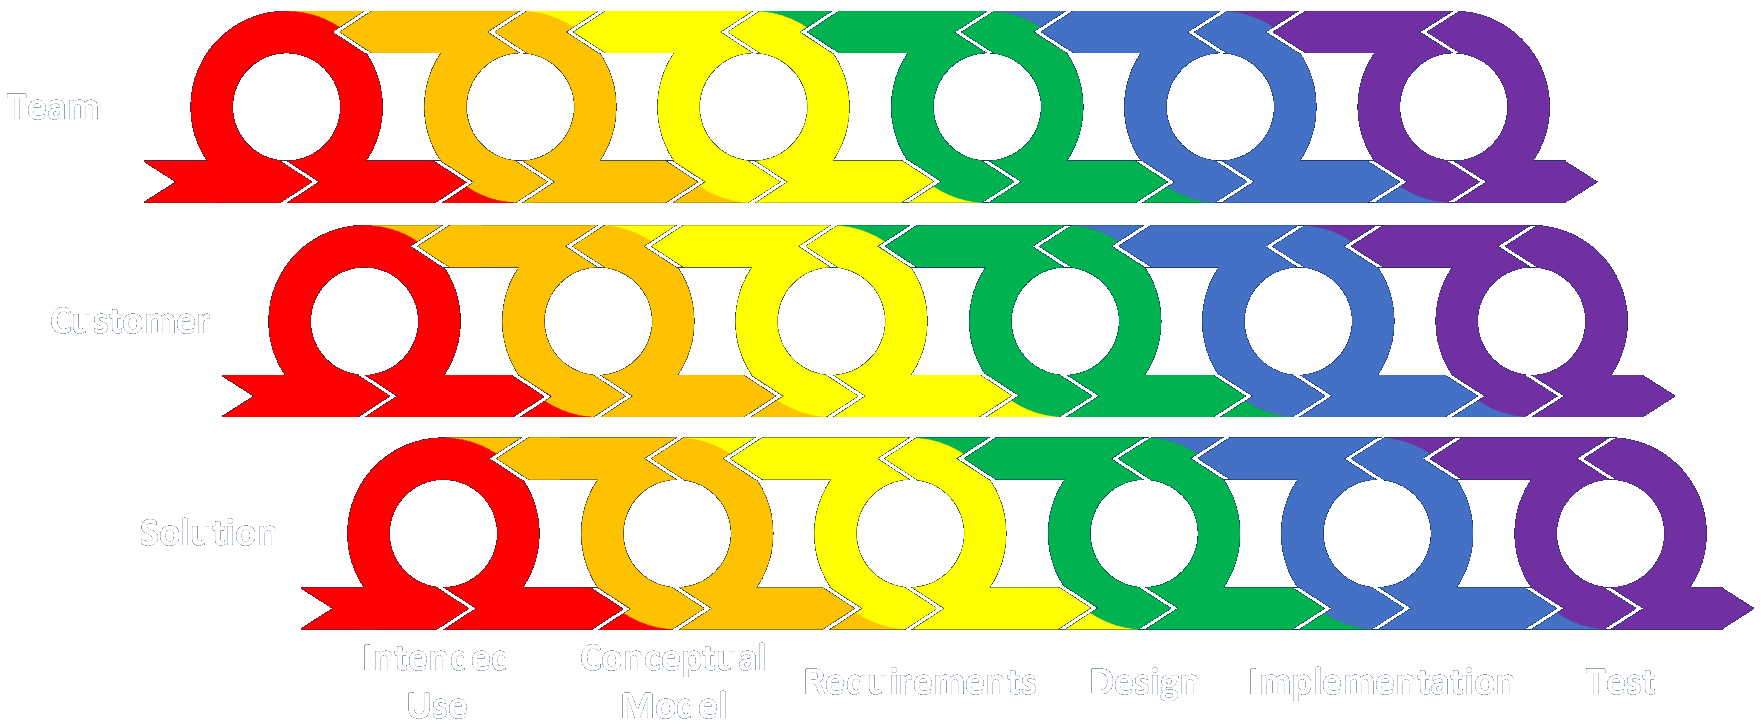
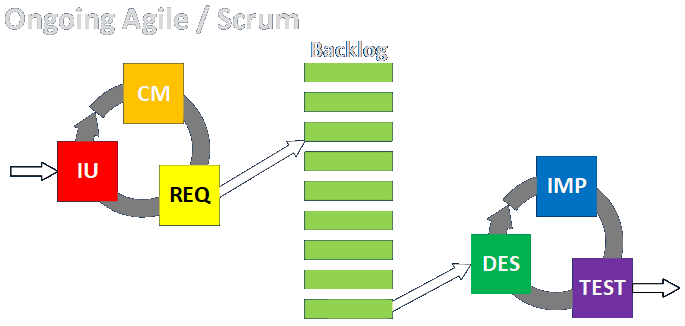
I like this definition because while lessons learned is often thought of as something you only do at the end of an effort, it’s really something you can and should do whenever it make sense. In the following figure I show my framework for managing engagements to develop solutions for customers. It involves iterating within and between phases to ensure proper understanding, thoroughness, completeness, correctness, and internal logical consistency are achieved in every phase and for every item. However, this process does not — or at least should not — occur only with respect to the solution.

Business analysts, along with all other team members and stakeholders, should be mindful to review and improve the way they work with and communicate with the customer, and also how they work with and do things within their internal teams. This also iterative process may involve different participants in different phases of an engagement, but the iteration within and between phases remains. Note that the Project Management framework specifically talks about establishing and revisiting things like stakeholder relationships, communication, cost, quality, risk, and so on. Business analysts should certainly be cognizant of these ongoing issues as well, and many of them are addressed by the BABOK, although often in a different way.

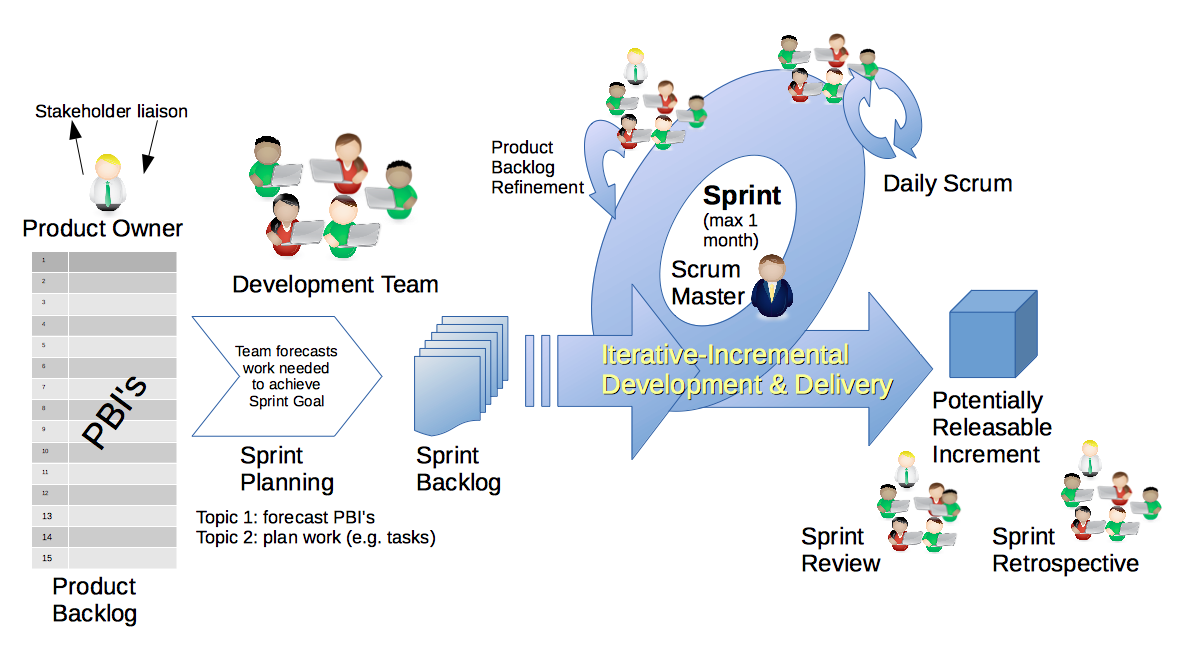
Looking at the specific case of Scrum, we see the Sprint Review and Sprint Retrospective being conducted at the close of each sprint. These represent not only a review of the work itself, but also of the methods of working with the customer and within the internal team, respectively.

Note that the traditional sprint diagram above only includes the items on the right hand side of the diagram below, which shows how all of the six phases of my framework are incorporated into the ongoing process. This is important because product backlog items (PBIs) don’t just magically appear from the ether. Someone is doing the work to identify, prioritize, and refine them, and one of the main practitioners is the business analyst, who is often considered to be a standard team member in the Agile/Scrum framework.

The bottom line is to be looking for ways to improve everything you do, in every context, with every contact, at all times. Everything that happens can be a lesson learned.

Posted in Tools and methods | Tagged , , | Leave a comment

Non-Functional Requirements Analysis

Functional requirements relate what a solution DOES.

They describe components, behaviors, entities, actions, inputs, and outputs. They contain the details of the design the user sees and the mechanisms that generate results.

Non-Functional requirements relate to what a system IS.

They describe qualities in terms of “-ilities,” e.g., reliability, modularity, flexibility, robustness, maintainability, scalability, usability, and so on.

I include descriptions of how the system is intended to be maintained and governed within non-functional requirements, but I suppose that’s a philosophical point.

All requirements should include the criteria by which functional and non-functional elements will be judged to be acceptable.

Requirements represent the To-Be State in abstract terms. The design represents the To-Be State in more concrete terms.

Many sources enumerate possible non-functional requirements, but the Wikipedia page provides a pretty inclusive list.

Posted in Tools and methods | Tagged , , | Leave a comment

Document Analysis

The BA technique of document analysis can be undertaken in many different contexts and phases of the effort. The major contexts for document analysis are:

  • Manuals, specifications, and contracts can be reviewed as part of the discovery process to learn how existing processes (in-house and those of competitors) work, including the behavior of machines and third-party or external or other black box processes, or how new processes may work.
  • The details of existing and generated processed documents can be examined to understand the information they contain to identify appropriate means of classification and identify fields and values that are currently used and may be used in the future.
  • Historical records can be reviewed to help quantify the scope, scale, and parameters governing existing operations in the data collection phase. That data can provide information on trends, problems, and opportunities.
  • Existing organizational policy documents can be read to understand how decisions are made within existing processes.
  • Existing and envisaged statutes and regulations can be researched to understand what requirements may affect or drive processes.

I describe many other kinds of documents here.

Determinations must me made on the authenticity, authority, completeness, and accuracy of documents. Documents should also be reviewed to identify ways to spot errors, omissions, and inconsistencies, as part of deciding whether any given document may be usable. This can apply to all types of documents and contexts listed above.

Here is how documents tend to be analyzed in different phases of an engagement.

Intended Use (Problem Definition): The need to process existing documents, modify existing documents, or generate new documents, is recognized or identified as the driving force or major component of any new effort. This would typically involve identifying high-level operations that would need to be performed on documents rather than considering low-level details of new or existing documents.

Conceptual Model: If an engagement involves figuring out what is going on currently (to accurately and completely define the As-Is state), then document analysis takes place in many different contexts during this phase. If the engagement is intended to create something entirely new, then these activities may be divided across the Requirements and Design phases.

Requirements: Requirements are driven by business needs and descriptions of the existing and future processes. All of the document types described at the beginning of this article are germane in every context.

Design: Once the requirements are understood, bearing in mind that many phases may continue to evolve iteratively, the work of design tends to focus on lower-level details of the documents being processed or generated, along with the documents that describe aspects or operations of the process itself.

Implementation: Document analysis does not typically take place in this phase, except as questions arising from this work may drive revisitation of work done in previous or subsequent phases.

Test (and Deployment and Acceptance): This phase mostly involves review of generated documents to ensure they contain the correct information in the correct format, and also review of processed (input) documents to ensure they are read properly and that the desired information was gathered, the proper decisions were made, and their disposition was properly determined.

Posted in Tools and methods | Tagged , , | Leave a comment