
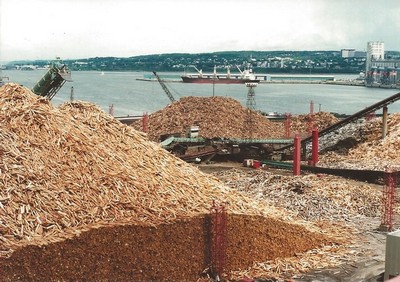
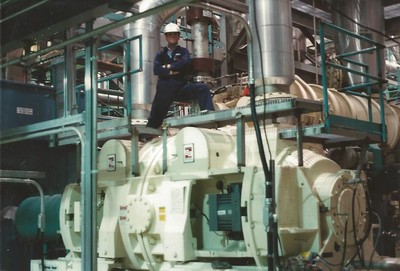
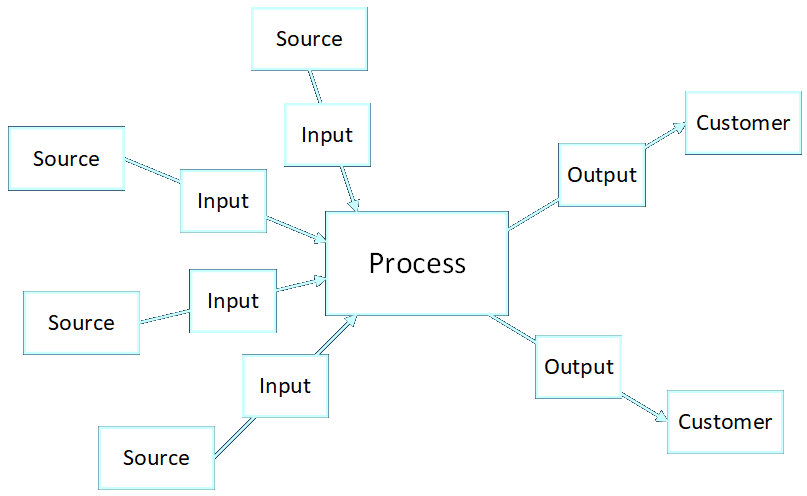
My first engineering job was as a process engineer in the paper industry, where I designed and analyzed large industrial systems that ran this…
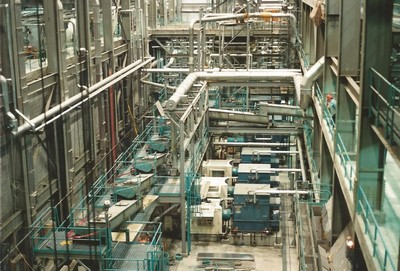
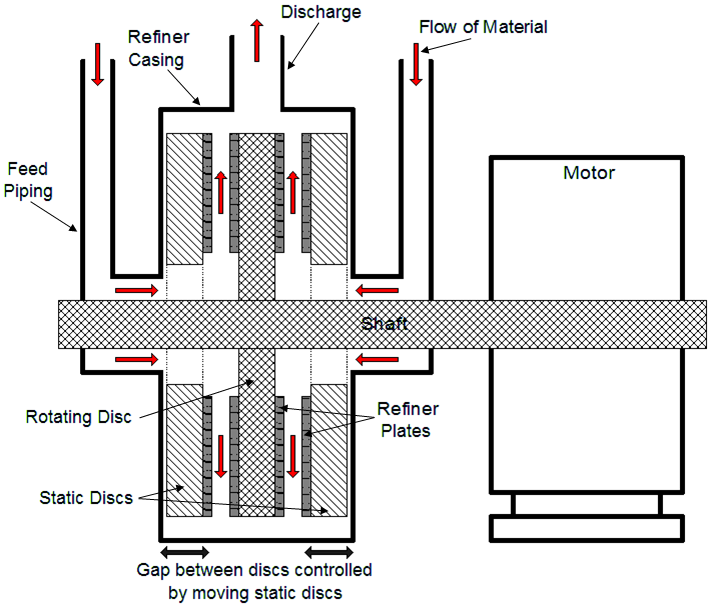
through this…
to make this…

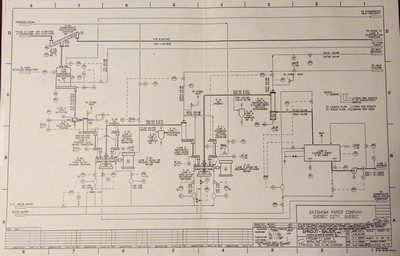
We can break the system down (or build it up) like this…
using components like this…
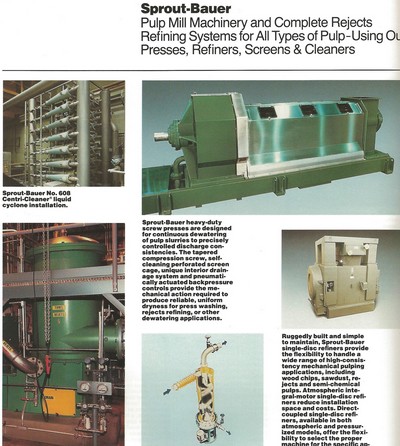
and this…
which can further be broken down like this…
…into as much detail as you’d like to get into.

When tracking items through an engagement…
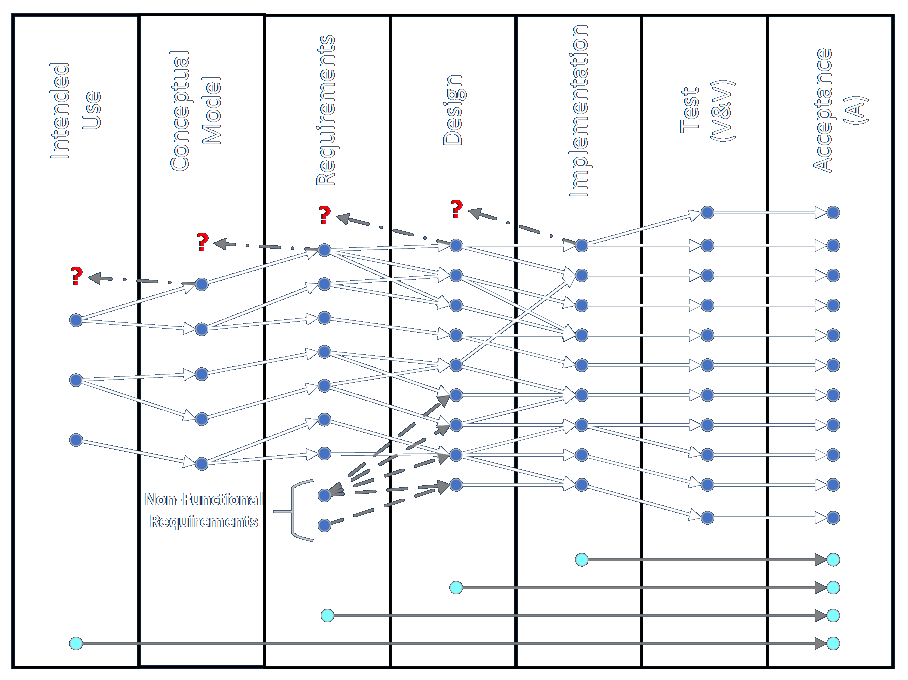
they can be decomposed as requirements are more elaborated and defined.
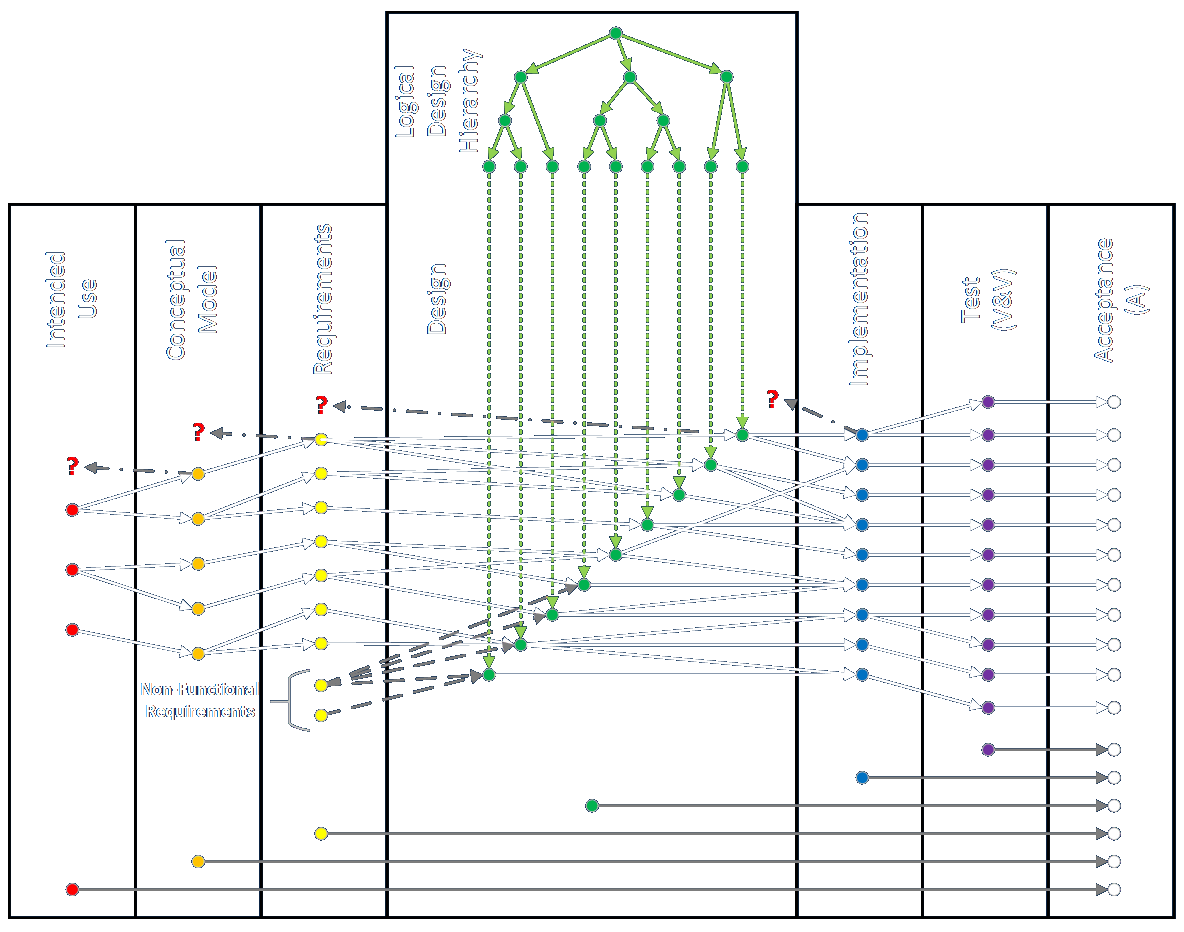
Remember that RTMs must crosslink horizontally across phases and vertically to define the logical, hierarchical relationships of the solution elements.
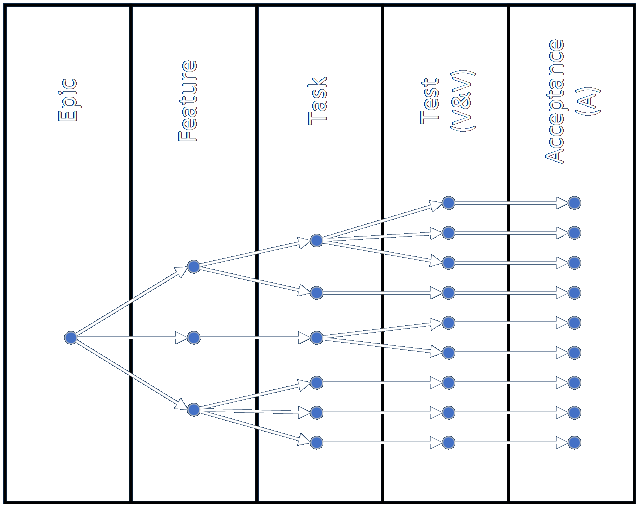
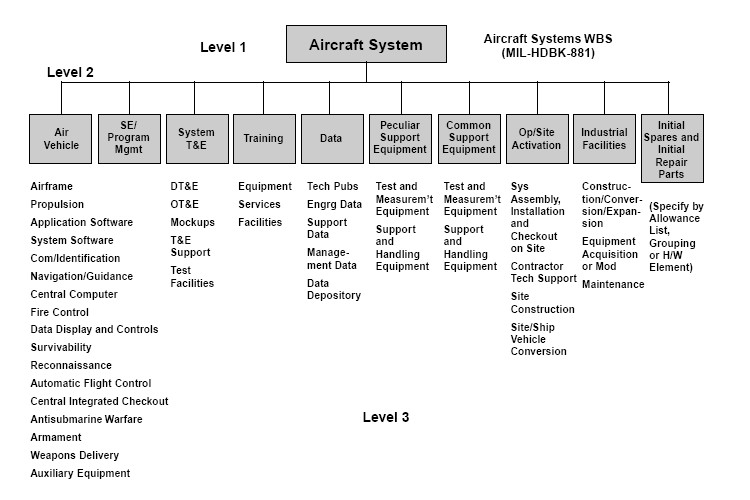
Here is a high level example of a hierarchical breakdown of a large system. Imagine this being rotated ninety degrees counter-clockwise and plotted vertically in the RTM shown above.
These two views can be merged as follows. (See full discussion here.)
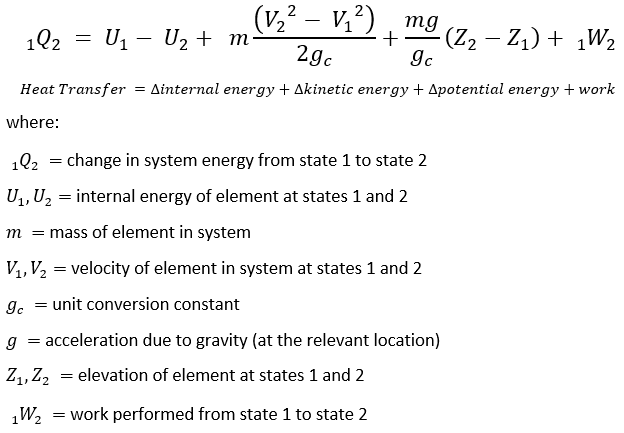
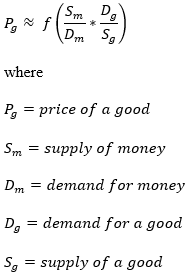
If a system can be described by known equations, each term can be analyzed in terms of identifying every possible effect that could make any individual variable larger or smaller, and also considering terms that may drop out entirely. The first equation is explicit and formal while the latter serves as more of a mnemonic.
This diagram shows the flow of calculations in a large spreadsheet, which is just another form of very long equation.
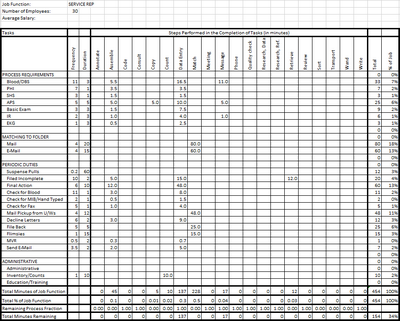
Behaviors and decisions can be analyzed down to very low levels.
Process models can be analyzed from the top down…
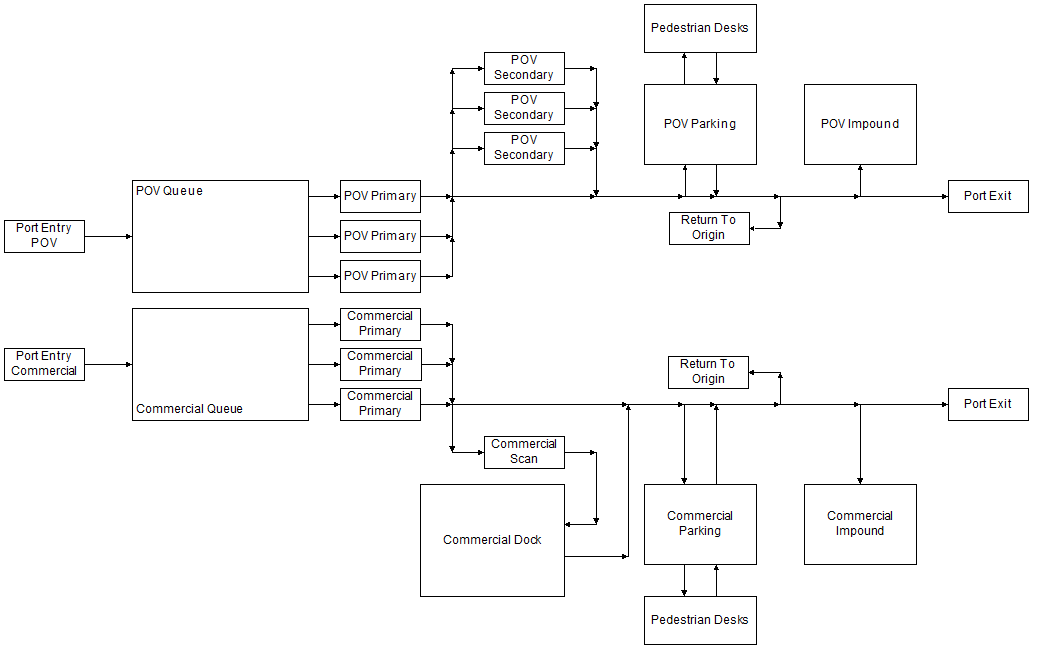
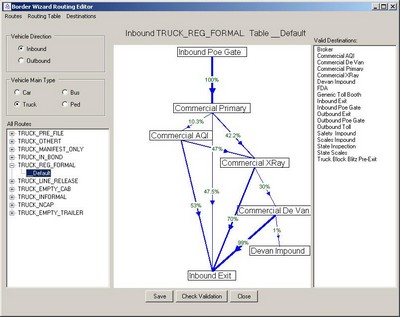
and from the bottom up. Multiple operations can take place within a location, station, or subprocess…
and those can be broken down in exacting detail.
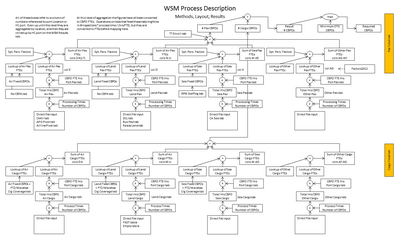
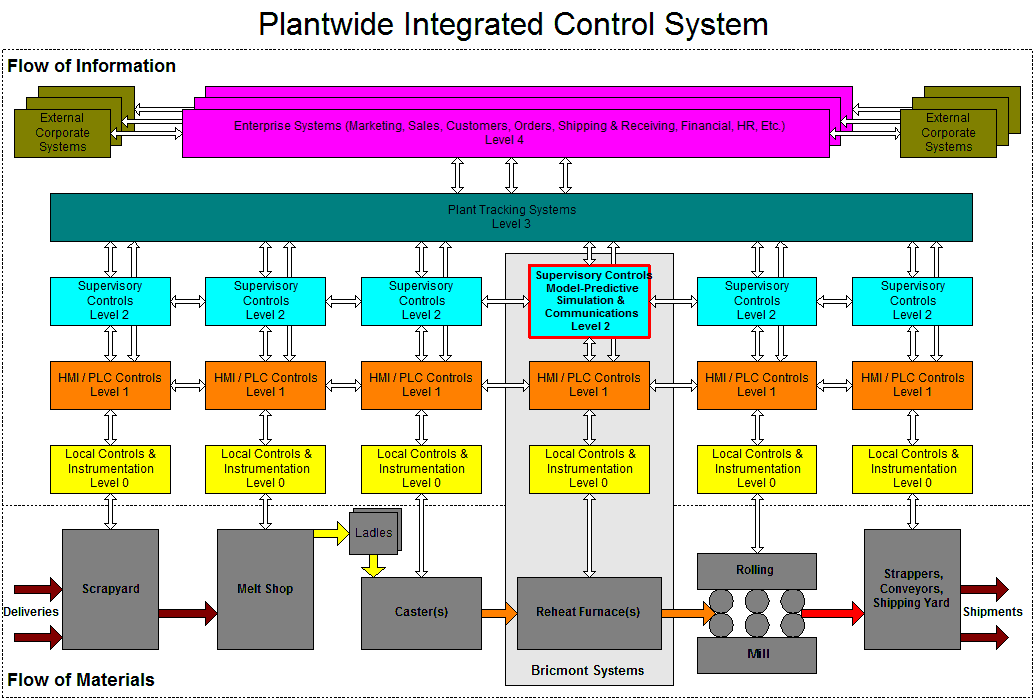
Large systems can be broken down to understand contexts and details. Each element in the diagram below is its own, highly complex entity involving the work of multiple creators and integration of a myriad of materials and technologies.
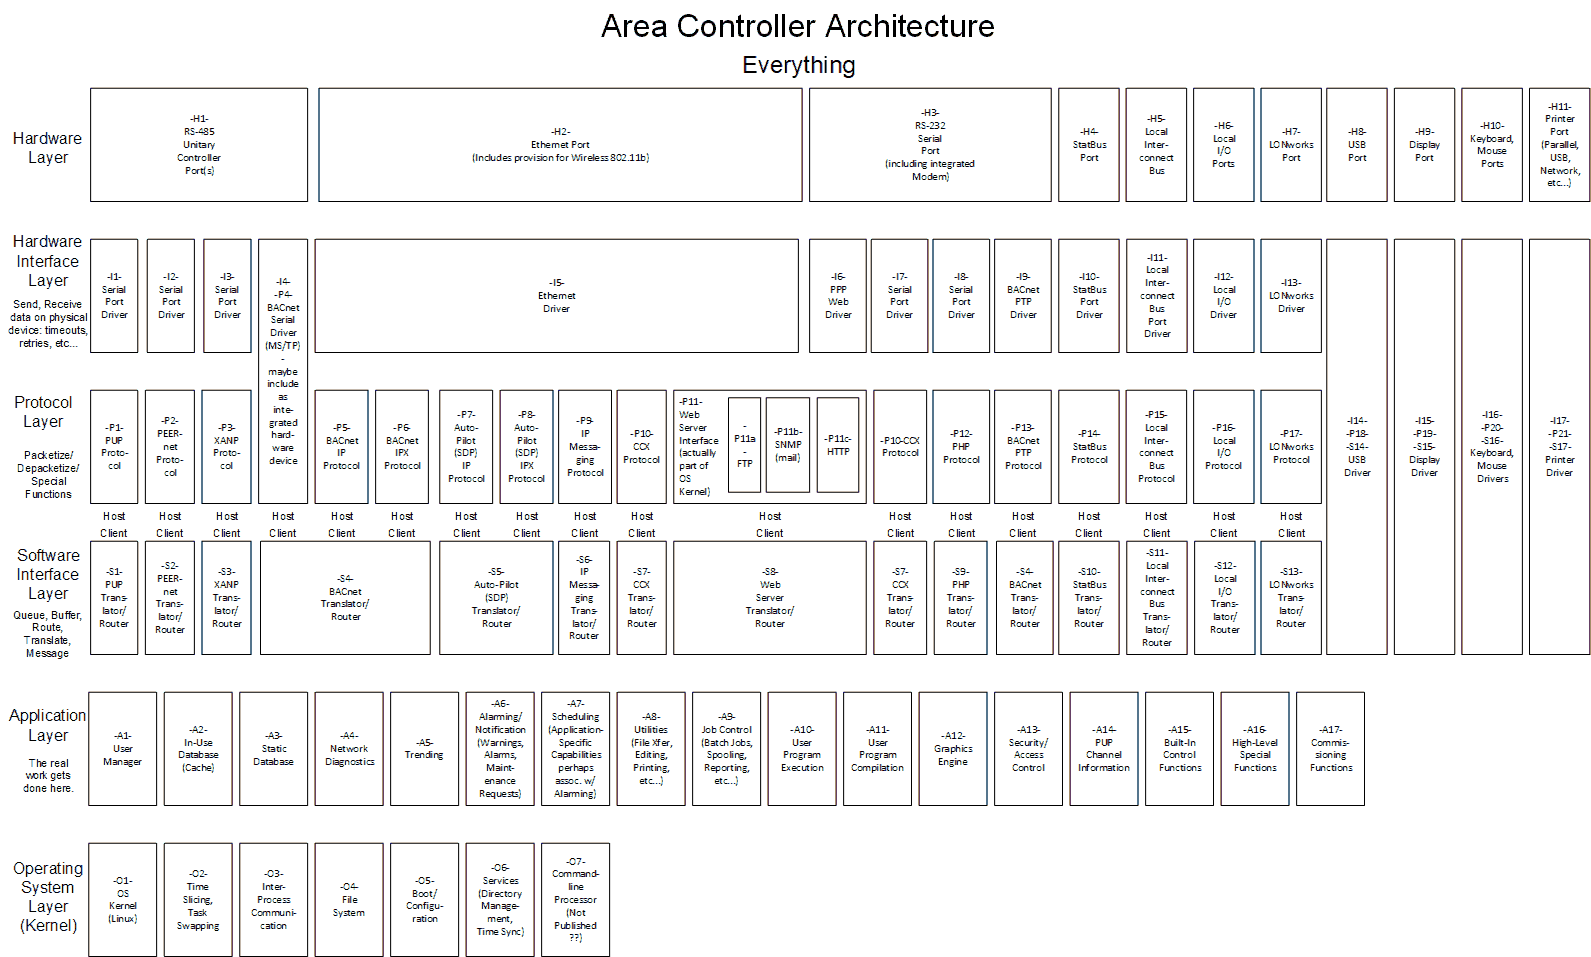
Analyzing all aspects of a systemic capability, potentially across multiple products, can highlight commonalities and differences, and can help identify opportunities to plug gaps, regularize techniques, increase modularization, and so on.
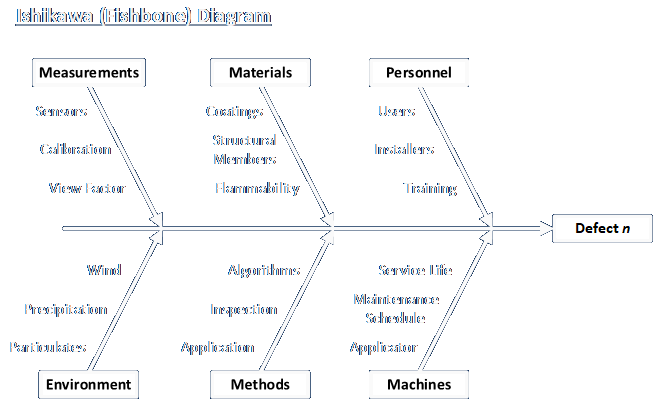
This type of diagram is a common tool to perform root cause analysis. The categories of the “ribs” could be remembered using 5 Ms and an E.
Employing many different modes of decomposition gives many possible perspectives and insights. This helps ensure that analyses will be thorough and robust.

The BABOK identifies the following categorizations on the subject, many of which are discussed above. Please consult the relevant section of the BABOK for further details.
- Decomposition Objectives
- Measuring and Managing
- Designing
- Analyzing
- Estimating and Forecasting
- Reusing
- Optimization
- Substitution
- Encapsulation
- Subjects of Decomposition
- Business Outcomes
- Work to be Done
- Business Process
- Function
- Business Unit
- Solution Component
- Activity
- Products and Services
- Decisions
- Level of Decomposition
- Per the examples above, decomposition can continue down through as many levels as make sense for a given analysis.
- Representation of Decomposition Results
- Tree diagrams
- Nested diagrams
- Use Case diagrams
- Flow diagrams
- State Transition diagrams
- Cause-Effect diagrams
- Decision Trees
- Mind Maps
- Component diagram
- Decision Model and Notation