
From the BABOK:
A data model describes the entities, classes or data objects relevant to a domain, the attributes that are used to describe them, and the relationships among them to provide a common set of semantics for analysis and implementation.
I’ve written about data in many contexts, but I usually start by pointing out that data is identified through the processes of discovery, which identifies the nouns and verbs of a process (the BABOK refers to these as entities), and data collection, which describes the adjectives and adverbs of a process (the BABOK refers to these as attributes). The BABOK further describes relationships or associations between entities and attributes (entities-attributes, entities-entities, attributes-attributes). Finally, this information is often represented in the form of diagrams.
Different types of data models are generated during different phases of an engagement (per my six-phase, iterative framework).
The conceptual data model is created during the conceptual model phase (oooh, there’s a shock!). This shows how the business thinks of its data, and these diagrams are produced as the result of the discovery and data collection processes mentioned above. This work may be folded into other phases if the engagement is meant to build something new, as opposed to modifying (or simulating) something that already exists.
The logical data model is typically developed during the requirements and design phases. This is an extension or abstraction of the conceptual data model that describes the relationships and rules for normalization that help govern and ensure the integrity of the data representation.
The physical data model is defined during the implementation phase. This shows how the data is physically and logically arranged in memory, files structures, databases, and so on.
There are many ways to list and describe data in diagrams.
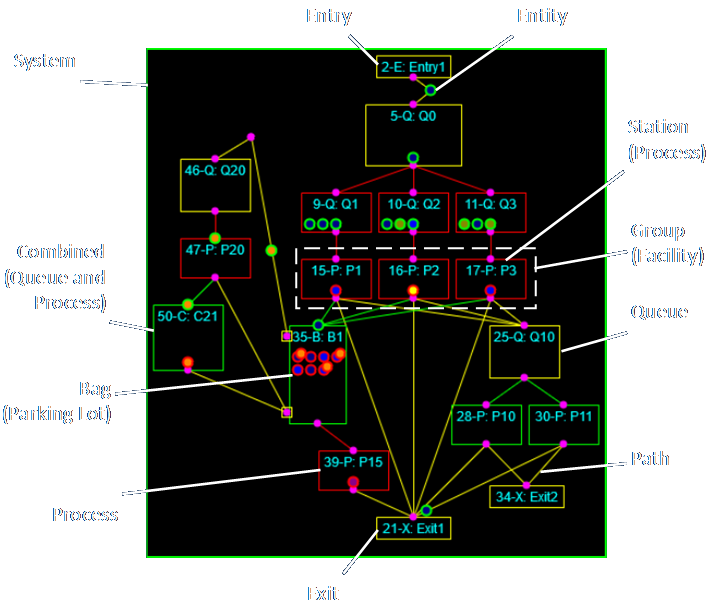
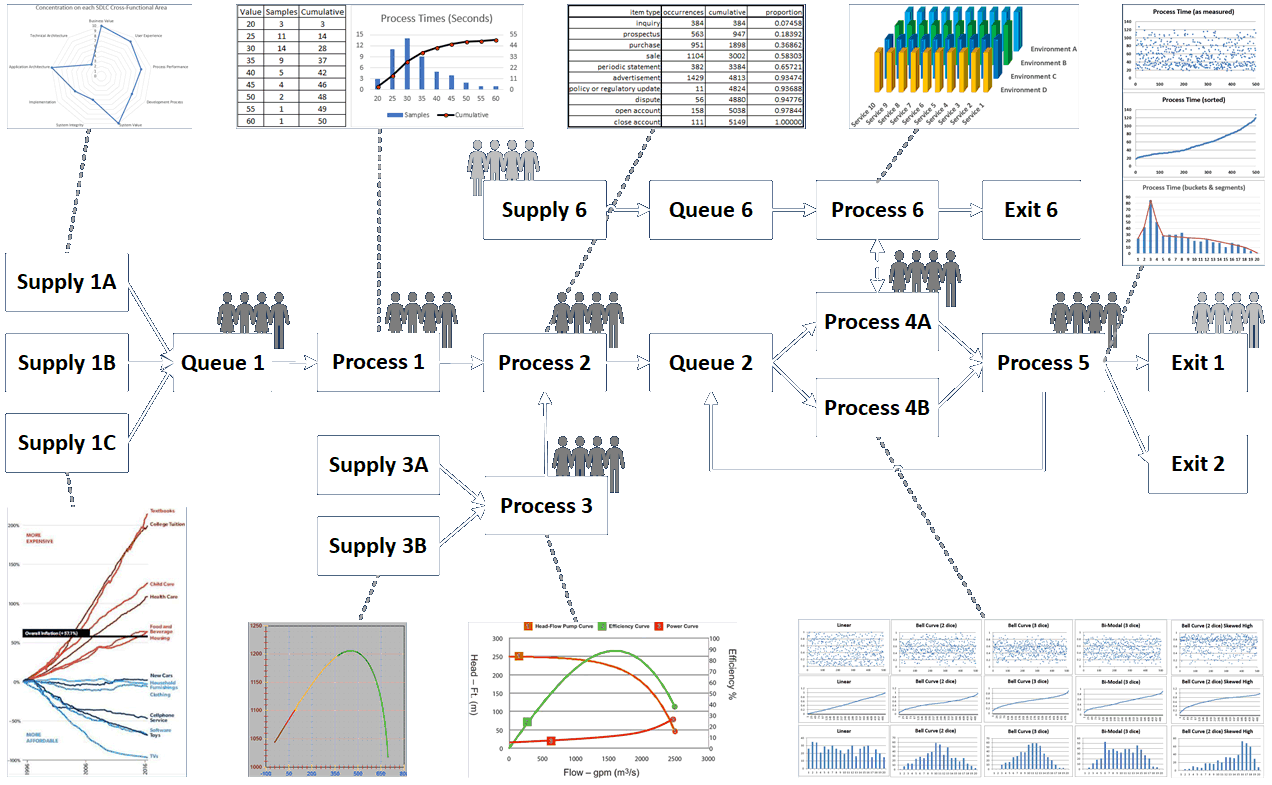
This diagram shows the nouns and some implied verbs of a system, sometimes using slightly different verbiage.
Here is a representation of the attributes associated with each identified entity.
Here is a simple representation of the physical location of data in an implemented system.
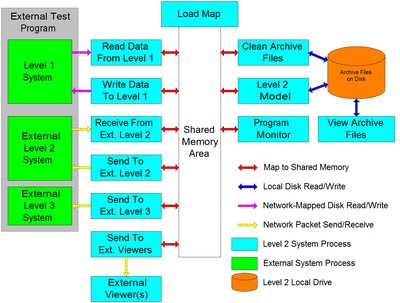
The header listing below shows a detailed description of the shared memory area from the diagram above.
|
1 2 3 4 5 6 7 8 9 10 11 12 13 14 15 16 17 18 19 20 21 22 23 24 25 26 27 28 29 30 31 32 33 34 35 36 37 38 39 40 41 42 43 44 45 46 47 48 49 50 51 52 53 54 55 56 57 58 59 60 61 62 63 64 65 66 67 68 69 70 71 72 73 74 75 76 77 78 79 80 81 82 83 84 85 86 87 88 89 90 91 92 93 94 95 96 97 98 99 100 101 102 103 104 105 106 107 108 109 110 111 112 113 114 115 116 117 118 119 120 121 122 123 124 125 126 127 128 129 130 131 132 133 134 135 136 137 138 139 140 141 142 143 144 145 146 147 148 149 150 151 152 153 154 155 156 157 158 159 160 161 162 163 164 165 166 167 168 169 170 171 172 173 174 175 176 177 178 179 180 181 182 183 184 185 186 187 188 189 190 191 192 193 194 195 196 197 198 199 200 201 202 203 204 205 206 207 208 209 210 211 212 213 214 215 216 217 218 219 220 221 222 223 224 225 226 227 228 229 230 231 232 233 234 235 236 237 238 239 240 241 242 243 244 245 246 247 248 249 250 251 252 253 254 255 256 257 258 259 260 261 262 263 264 265 266 267 268 269 270 271 272 273 274 275 276 277 278 279 280 281 282 283 284 285 286 287 288 289 290 291 292 293 294 295 296 297 298 299 300 301 302 303 304 305 306 307 308 309 310 311 312 313 314 315 316 317 318 319 320 321 322 323 324 325 326 327 328 329 330 331 332 333 334 335 336 337 338 339 340 341 342 343 344 345 346 347 348 349 350 351 352 353 354 355 356 357 358 359 360 361 362 363 364 365 366 367 368 369 370 371 372 373 374 375 376 377 378 379 380 381 382 383 384 385 386 387 388 389 390 391 392 393 394 395 396 397 398 399 400 401 402 403 404 405 406 407 408 409 410 411 412 413 414 415 416 417 418 419 420 421 422 423 424 425 426 427 428 429 430 431 432 433 434 435 436 437 438 439 440 441 442 443 444 445 446 447 448 449 450 451 452 453 454 455 456 457 458 459 460 461 462 463 464 465 466 467 468 469 470 471 472 473 474 475 476 477 478 479 480 481 482 483 484 485 486 487 488 489 490 491 492 493 494 495 496 497 498 499 500 501 502 503 504 505 506 507 508 509 510 511 512 513 514 515 516 517 518 519 520 521 522 523 524 525 526 527 528 529 530 531 532 533 |
/* common.h this file contains all declarations for the common memory map */ const short itcPrograms = 8; const short itcHeats = 10; const short itcZones = 5; const short itcPosns = 50; const short itcRows = 2; const short itcHigh = 7; const short itcWide = 21; const short itcNodes = 147; //itcWide * itcHigh; const short itcBandWid = 8; //itcHigh + 1; const short itcMatls = 1; const short itcCFPnt = 12; const short itcMaxGaps = 5; const short itcPceTypes = 1; const short itcSoakZoneBegin = 67 * 12; const short itcIntermediateZoneBegin = 41 * 12; const short itcExternals = 8; const float rtcBotView = 0.96565; const float rtcEfurnace = 0.90; const float rtcEsteel = 0.79; const float rtcKRad = 0.1713E-8 / (3600.0 * 144.0); const float rtcRadCof = rtcEfurnace * rtcEsteel * rtcKRad; const float rtcTabs = 459.67; const float rtcTstep = 40.0; const float rtcITstep = 1.0 / rtcTstep; struct TPc { char piece_id[7]; //7 char melt_grade[3]; //10 float thickness; //14 float width; //18 float length; //22 float aim_temp; //26 float aim_diff; //30 float priority; //34 + 2 as a filler }; union TKVInMsg { struct { char stx[3]; //3 + 1 filler TPc rows[2][50]; //3604 char time[15]; //3619 char okflag; //3620 char etx[3]; //3623 + 1 filler } msg; struct { char fred[3800]; } str; }; struct TKVOutMsg { char row1ID[7]; char row2ID[7]; short row1Temp; short row2Temp; short request; }; struct TArcKVIn { double fTime; TPc pieces[2]; short okflag; short count[2]; }; struct TArcKVOut { double fTime; TKVOutMsg data; short row1count; short row2count; }; union TArcSlb { struct { short iTag; double fTime; } base; struct { //iTag = 0 short iTag0; double fTime0; char sPieceID[8]; char sGrade[4]; short iRebuildFlag; } charge0; //22bytes struct { //iTag = 1 short iTag1; double fTime1; short iThicknessX10; short iWidthX10; short iLengthX10; short iPriority; short iAimTemp; short iAimDiff; } charge1; //22 bytes struct { //iTag = 2 short iTag2; double fTime2; short iFceMode; short iPceMaxT; short iPceMinT; short iPceAvgT; short iTopTFce; short iBotTFce; short iFcePosn; } rundata; //26 bytes struct { //iTag = 3 //discharge or event short iTag3; double fTime3; short iEventType; //1=disch 2=entered intermediate 3=entered soak 4=deleted double fElapsedTime; short iDischTemp; short iDischDiff; } discharge; //24 bytes struct { //iTag = 4 //edit short iTag4; double fTime4; char sNewID[8]; short iNewAim; bool lNewGrade; } edit; //20 bytes }; struct TPieceData { char sPieceID[8]; //ID, string char sGrade[4]; //material grade, string short iPriority; //priority, control higher first, dim0 short iAimTemp; //desired discharge temperature, °F short iAimDiff; //disired differential temperature, °F short iStatus; //status of pc data, dim0 float rLength; //length, |-- to travel, in float rWidth; //width, || to travel, in float rThickness; //thickness, above hearth, in float raT[itcWide+1][itcHigh+1]; //nodal temperatures, °F float rLocation; //distance from beginning of fce, in float rTFceTop; //temp above piece, °F float rTFceBot; //temp below piece, °F float rTAvg; //current average temp, °F float rTHi; //current highest temp, °F float rTLo; //current lowest temp, °F float rTDiff; //current differential temp, °F float rLTAvg; //predicted average temp, °F float rLTHi; //predicted highest temp, °F float rLTLo; //predicted lowest temp, °F float rLTDiff; //predicted differential temp, °F float raVFSkid[itcWide+1][8][8]; //bottom view factors, norm 1=square, 2=norm, 3 = norm,ofs, 4 = ofs, 5 = ofs,center, 6 = norm,ofs,center, 7 = norm,center // skids @ -28.25,-22.75, 0.0, 22.75, 28.25, []-22.75, []28.25 float raDSkid[itcWide+1][8][8]; //distance to skid float raWSkid[itcWide+1][8][8]; //width of skid at that distance short iSkid1a; short iSkid1b; short iSkid2a; short iSkid2b; short iCenter; bool lInFce; //flag for piece in fce, logical bool lCalcFlag; short iArcIndex; //which archive record written next TArcSlb uaArcRecords[4]; //archive record buffer TDateTime fChargeTime; //time piece charged int dTimeRemaining; //estimated time until piece discharges char sArchiveFileName[50]; //name & location of archive file }; struct TZone { short iTC1; //2 short iTC2; //2 float rTAv; //4 short iMTC; //2 short iL1Spt; //2 short iL2Spt; //2 float rFuelPct; //4 float rAirPct; //4 float rMode; //4 }; //26 bytes struct TDisplayPieceData { char sPieceID[8]; // 8/ 8/ID, string char sGrade[4]; // 4/12/material grade, string short iPriority; // 2/14/priority, control higher first, dim0 short iAimTemp; // 2/16/desired discharge temperature, °F short iAimDiff; // 2/18/disired differential temperature, °F short iStatus; // 2/20/status of pc data, dim0 float rLength; // 4/24/length, |-- to travel, in float rWidth; // 4/28/width, || to travel, in float rThickness; // 4/32/thickness, above hearth, in float rLocation; // 4/36/distance from beginning of fce, in short rTFceTop; // 2/38/temp above piece, °F short rTFceBot; // 2/40/temp below piece, °F short rTAvg; // 2/42/current average temp, °F short rTHi; // 2/44/current highest temp, °F short rTLo; // 2/46/current lowest temp, °F short rTDiff; // 2/48/current differential temp, °F short rLTAvg; // 2/50/predicted average temp, °F short rLTHi; // 2/52/predicted highest temp, °F short rLTLo; // 2/54/predicted lowest temp, °F short rLTDiff; // 2/56/predicted differential temp, °F bool lInFce; // 2/58/flag for piece in fce, logical TDateTime fChargeTime; // 8/66/time piece charged int dTimeRemaining; // 4/70/estimated time until piece discharges }; //70 total bytes + 2 spacers struct TViewData { char sDummy[4]; //- 4/ TDisplayPieceData PC[itcPosns][itcRows]; //-7200/ short iaAlarms[10]; //- 20/ double faLevel2Elapsed[itcPrograms]; //- 64/ time since last iteration began TDateTime faLevel2Start[itcPrograms]; //- 64/ time last iteration began short iaLevel2Cycle[itcPrograms]; //- 16/ number of seconds for typical loop short iaLevel2Death[itcPrograms]; //- 16/ max number of seconds until program declared dead char saLevel2Names[itcPrograms][30]; //- 240/ program name strings (30 characters each short iaZoneSetpoints[itcZones]; // 8/ short iModelNotReady; //- 2/ short iCombMode; //- 2/ short iaDischTempError[itcRows]; //- 4/ short iaSlabsInFurnace[itcRows]; //- 4/ short iaSlabsInKVList[itcRows]; //- 4/ short iaSlabsOutside[itcRows]; //- 4/ int dDelayTimeToStart; //- 4/ int dDelayTimeToEnd; //- 4/ short iDelayStatus; //- 2/ short iL1toL2Retries; //- 2/ short iL2toL1Retries; //- 2/ float rModelDuration; //- 4/ int dPieceCalcs; //- 4/ float rTotalInchesPerHour; //- 4/ float raInchesPerHour[itcRows]; //- 8/ short iaFirstStandAvgT[itcRows]; //- 4/ short iaFirstStandTopT[itcRows]; //- 4/ float rHearthCoveragePercent; //- 4/ short iKVOKFlag; //- 2/ TZone uaZones[itcZones]; //- 104/ TDateTime fLevel2Time; // 8/ float rPressure; //- 4/ float rPressureSpt; //- 4/ short iWasteGasTemp; //- 2/ short iaDischarges[itcRows]; //- 4/ short iaAimTemp[4]; //- 8/ short iaUseL1AimFlag[4]; //- 8/ short iCoolingTime; //- 2/ short iBPZOffset; //- 2/ short iBIZOffset; //- 2/ short iaCriticalPos[3]; //- 6/ short iaCriticalRow[3]; //- 6/ short iaCurrentDischarges[itcRows]; //- 4/ }; //8056 struct TL1Data { TZone uaZones[itcZones+1]; float rPressure; float rPressureSpt; short iWasteGasTemp; short iaDischarges[itcRows+1]; short iaAimTemp[4+1]; short iaUseL1AimFlag[4+1]; short iPZRampDownRate; short iPZMinTemp; short iPZRampUpRate; short iIZRampDownRate; short iIZMinTemp; short iIZRampUpRate; short iSZRampDownRate; short iSZMinTemp; short iSZRampUpRate; int iDelayDuration; short iStartHour; short iStartMinute; char sStartSlabID[8]; short iImmediateDelayStart; short iScheduledDelayStart; short iRecoverFromDelay; short iEndDelay; short iDurationChange; short iChangeDurationFlag; short iCoolingTime; short iBPZOffset; short iBIZOffset; short iaThickMaxSpt[itcZones+1]; short iaThinMaxSpt[itcZones+1]; int dWatchDog; }; struct TArcEvent { double fTime; float rPressure; float rPressureSpt; float rHearthCoverage; short iMode; short iaAlarms[10]; char saChargeID[itcRows][8]; char saChargeGrade[itcRows][4]; char saDischID[itcRows][8]; char saDischGrade[itcRows][4]; short iaDischTemp[itcRows]; short iaDischAimTemp[itcRows]; float raAvgDischargeTime[itcRows]; float raAvgInchesPerSecond[itcRows]; short iDelayMode; int dTimeToStart; int dTimeFromStart; int dTimeToEnd; short iWasteGasTemp; TZone uaZones[itcZones]; char iaOutsideCount[itcRows]; short iModelNotReady; }; struct TAuxData { TKVInMsg KVAuxIn; TKVOutMsg KVAuxOut; bool lAuxIn; bool lAuxOut; char sID[8]; char sGrade[4]; int dIDCount; float rLength; float rWidth; float rThickness; float rCycleTime; float rAimTemp; float rAimDiff; short iPriority; float rTimeStep; float rRunTime; bool lRandomPDI; bool lRunning; bool lDataOK; bool lSendChange; short iaRowCount[itcRows]; short iNextRow; char sDateTime[15]; TZone uaZones[itcZones+1]; bool lZone1TC1Disabled; bool lZone1TC2Disabled; bool lZone1MTCDisabled; bool lZone2TC1Disabled; bool lZone2TC2Disabled; bool lZone2MTCDisabled; bool lZone3TC1Disabled; bool lZone3TC2Disabled; bool lZone3MTCDisabled; bool lZone4TC1Disabled; bool lZone4TC2Disabled; bool lZone4MTCDisabled; bool lZone5TC1Disabled; bool lZone5TC2Disabled; bool lZone5MTCDisabled; bool lWasteGasTCDisabled; float rPressure; float rPressureSpt; short iWasteGasTemp; short iaDischCount[itcRows]; short iLv1Watchdog; short iaDefAimTemp[4+1]; short iaUseL1AimFlag[4+1]; short iModelNotReady; short iaL2Alarms[11]; short iLv2Watchdog; short iLv2Year; short iLv2Month; short iLv2Day; short iLv2Hour; short iLv2Minute; short iLv2Second; short iLv2DchTemp1Error; short iLv2DchTemp2Error; short iLv2TimeToStart; short iLv2TimeToEnd; short iLv2ReplyFlag; short iLv2Dummy[4]; short iDelayCommFlag; short iDelayTimeToStart; short iDelayTimeToEnd; short iPZRampDownRate; short iPZMinTemp; short iPZRampUpRate; short iIZRampDownRate; short iIZMinTemp; short iIZRampUpRate; short iSZRampDownRate; short iSZMinTemp; short iSZRampUpRate; short iDelayDuration; short iStartHour; short iStartMinute; char sStartSlabID[10]; short iImmediateDelayStart; short iScheduledDelayStart; short iRecoverFromDelay; short iDurationChange; short iChangeDurationFlag; short iEndDelay; short iBPZOffset; short iBIZOffset; short itcStandAloneFactor; short iCoolingTime; bool laNoCharge[itcRows]; bool laNoDischarge[itcRows]; bool lDecayTemps; short iaSlabsOutside[itcRows+1]; short iaThickMaxSpt[itcZones+1]; short iaThinMaxSpt[itcZones+1]; }; struct TCommonData { TL1Data L1; //level 1 data double f2aLevel2Elapsed[itcPrograms+1]; //time since last iteration began TDateTime f2aLevel2Start[itcPrograms+1]; //time last iteration began short i2aAlarms[11]; //alarm values short i2aLevel2Cycle[itcPrograms+1]; //number of seconds for typical loop short i2aLevel2Death[itcPrograms+1]; //max number of seconds until program declared dead int dtWatchDogCount; char s2aLevel2Names[itcPrograms+1][30]; //program name strings (30 characters each TPieceData PC[itcPosns+1][itcRows+1]; //pieces in furnace by position and row (east/center/west) TPieceData SavePC[itcPosns+1][itcRows+1]; //saved pieces in furnace by position and row (east/center/west) TPieceData utZeroPiece; //sample piece record filled with null data TPieceData utaFirstTwoPieces[itcRows+1]; short itaFirstStandTemps[itcRows+1]; short itaFirstStandTops[itcRows+1]; short itaZoneSpt[itcZones+1]; //zone setpoints to be sent down to level 1 TZone utaZones[itcZones+1]; //zone data TZone utaSaveZones[itcZones+1]; //saved zone data short itSaveWasteGasTemp; TL1Data L2; char staOldChargeID[9][itcRows+1]; char staOldDischargeID[9][itcRows+1]; short itaOldCharges[itcRows+1]; short itaOldDischarges[itcRows+1]; short itDay; short itMonth; short itYear; long dtDefaultID; char stPieceArchivePath[30]; char stEventArchivePath[30]; char stKVArchivePath[30]; int dtaLastFiftyCharges[51][itcRows+1]; float rtaLastFiftyWidths[51][itcRows+1]; int dtaModelLastFiftyCharges[51][itcRows+1]; float rtaModelLastFiftyWidths[51][itcRows+1]; float rtaLastTenInchesPerSecond[11][itcRows+1]; float rtaAvgDischargeTime[itcRows+1]; float rtaAvgDischargeWidths[itcRows+1]; float rtaAvgInchesPerSecond[itcRows+1]; float rtaTopTCOffsets[11+1]; float rtaBotTCOffsets[11+1]; char staOldChargeBloomID[10][itcRows+1]; bool ltSendDischargeData; bool ltDischargeDataSent; bool ltStandAlone; bool ltCompact; bool ltGraphics; bool ltArchive; TKVInMsg utKVInMsg; TKVInMsg utKVIn; TKVOutMsg utKVOutMsg; TKVOutMsg utKVOut; float rtFceLength; float rtFceWidth; float rtFceArea; short itModelNotReady; short itaDischTempError[itcRows+1]; float rtHearthCoveragePct; short itTAmbient; int dtDelayDuration; int dtDelayTimeToStart; int dtDelayTimeFromStart; int dtDelayTimeToEnd; short itaDelayInitialTemps[4]; int dtaDelayRampDownTimeLeft[4]; int dtaDelayMinTempTimeLeft[4]; int dtaDelayRampUpTimeLeft[4]; short itaDelayRampDownRate[4]; short itaDelayMinTemp[4]; short itaDelayRampUpRate[4]; int dtaDelayRampDownTime[4]; int dtaDelayMinTempTime[4]; int dtaDelayRampUpTime[4]; bool ltInDelay; short itDelayPrimaryTurnDown; short itDelayIntermediateTurnDown; short itaCriticalPos[4]; short itaCriticalRow[4]; float rtaZoneError[4]; float rtaZoneAdjust[4]; float rtaZoneResult[4]; float rtaZoneNudge[4]; float rtaZoneDiff[4]; float rtaZoneDiffError[4]; short itaSlabsInFurnace[itcRows+1]; short itaSlabsInKVList[itcRows+1]; short itaSlabsOutside[itcRows+1]; double ftStartTime; short itDelayMode; short itDelayOldMode; short itDelayStatus; short itDelayCommFlag; bool ltPredict; bool ltControl; short itDelayTempMsgCount; float rtaInternalL2Setpoints[itcZones+1]; short itcStandAloneFactor; short itaPastTAvgs[401][itcZones+1]; short itaPastMTCs[401][itcZones+1]; short itaPastWGTs[401]; short itaPastRates[401]; short itPastTempCount; short itaPastDischarges[401][itcRows+1]; bool ltaZoneAvTError[itcZones+1]; bool ltaZoneMTCError[itcZones+1]; bool ltWasteGasTCError; float rtaZoneMaxSpt[itcZones+1]; float rtaZoneMinSpt[itcZones+1]; float rtcZoneMaxStep; float rtcZoneMinStep; float rtcZoneMaxVar; short itcaZoneMTCOffset[itcZones+1]; short itCombMode; short itL1toL2Retries; short itL2toL1Retries; char staIPAddresses[itcExternals+3][16]; char staPortAddresses[itcExternals+3][6]; bool ltaNetworkOKFlags[itcExternals+3]; bool ltaAddressChanged[itcExternals+3]; bool ltaValidAddresses[itcExternals+3]; bool ltModelFlag; TViewData V; int dtatemp[201]; float ftatemp[201]; bool ltatemp[201]; char statemp[201][101]; }; |
Here is a more complicated and explicit representation of data in a database.

The BABOK describes two specific types of diagrams, an Entity-Relationship Diagram using Crow’s Foot notation, and a Class Diagram from UML. I recommend researching these two types of diagrams as questions about them may arise on the CBAP exam and other exams.