
Organizational modeling is a technique for representing the functional, operational, or physical structure of cohesive groups of people. The most common way of doing this is by using organizational charts or “org charts.” The traditional way these are shown is as some kind of hierarchy, but other methods of representation are possible.
One of the big issues when organizing a hierarchical structure is defining a taxonomy, and that involves making decisions on which kinds of divisions will take precedence. I touched on an aspect of this when I discussed my attempt to classify all my Lego pieces when I was about fourteen. The major ways hierarchies can be defined are by function, product line, type of customer served, and the like. These all prioritize on similar criteria but in a different order.
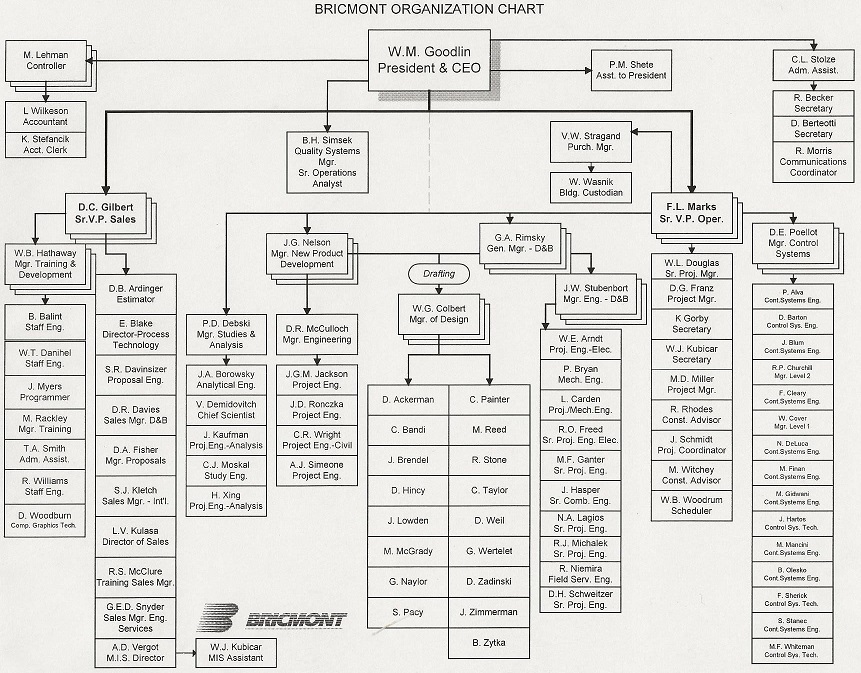
The chart above includes a lot of standard elements. I worked for this company from 1994 to 2000 and had a fabulous time (but also got very burned out). The main hierarchy is based on a president and two VPs, a bunch of departments and layers of managers arranged under them (occasionally sharing functions like drafting), and special functional groups and individuals attached and reporting where needed.
The other major way organizations might be models is in matrix format. In this case, different entities will report to two different types of managers, each with different concerns and responsibilities. For example, one axis of control (think of items in the rows of a grid) might be concerned with different product lines, while the other axis of control (the columns in a grid) might concern itself with different job functions needed to make up teams. Another possible axis can be defined for specific projects and programs. This is always a trick to get right, and the problem of responsibilities without authority often arises.
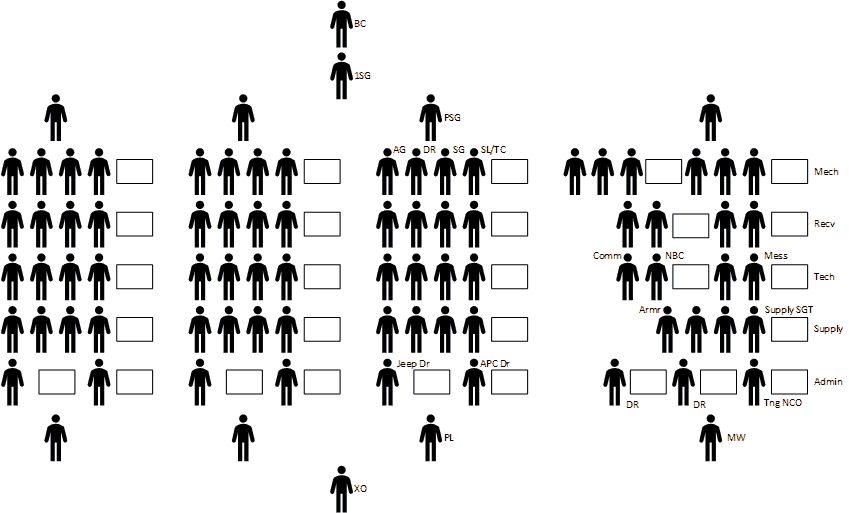
The representation below is of the type of air defense artillery unit I used to work for. I served in several different positions during my time in the service and learned a lot from each one. I’ve included a rough representation of vehicles in the unit, but as I think about it I’m certain I’m leaving some out of the representation for the headquarters platoon to the right. The three platoons to the left all included four self-propelled Vulcan air defense cannons (long since retired), an APC from which the platoon leader commanded the platoon, and a jeep for the platoon sergeant. There are actually standard symbols for representing different kinds of military entities, one of which is linked here.
Organizational charts can be as varied and complex as you’d like, and a decent amount of humor can be associated with this idea. Try an image search on the internet using the words funny org charts to see some clever examples.
What most organizational models have in common are the following elements.
- Model type: functional or matrix as described above
- Roles: titles and duties with different people and groups hold and perform
- Interfaces: connections between groups and entities along which information and materials can be exchanged
- Charts: boxes show entities and groups, lines show reporting and other relationships
- Influencers: formal and informal sources of information, power, and sway within the organization