A Simulationist's Framework
for Business Analysis
Part 13:
Artifacts Needed to Understand
the Full Story
R.P. Churchill
CBAP, PMP, CSPO, CSM, A-CSDLean Six Sigma Black Belt
www.rpchurchill.com/presentations/TWSLseries/13_Artifacts www.rpchurchill.com | Portfolio | Presentations
30 Years of Simulation
Continuous simulation of the heating of a square billet and Discrete-Event simulation of a multi-phase process.
30 Years of Simulation
|
Industries
|
|
|
Building Shared Situational Awareness
Each Post-It is a separate user story. The red ones along the top describe the MVP (minimum viable product).
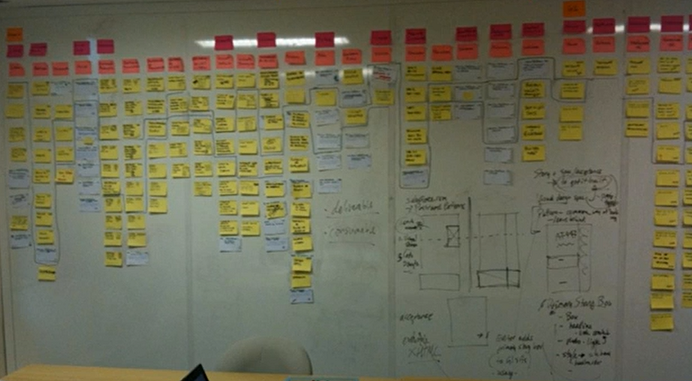
Q: How well do you think this might work?
A: Reasonably OK — for a familiar team on an effort of limited scope.
So what could go wrong?
Problems with User-Stories-Only Approach

User stories can give a fairly reasonable view of what needs to be done, but the devil is in the details.
- Not all concepts are most clearly communicated in words.
- Some needs are not best expressed in "As role X I want to take Y action to achieve Z result" format.
- It can be difficult to see how all the expressed requirements relate to each other logically and contextually.
- Per advertising executive Fred R. Barnard, "A picture is worth a thousand words."
User stories can give you one point of view. The artifacts on the following pages provide other points of view that help pull the whole picture together.
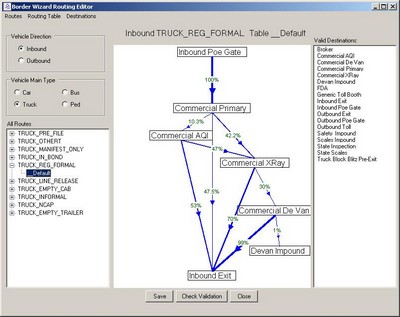
Process Models
Process maps show how all the pieces fit together and can show the overview of the entire process.
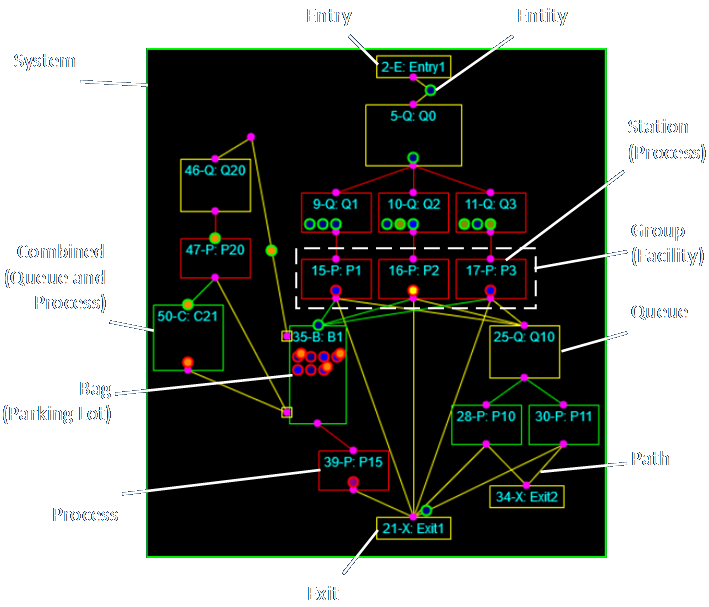
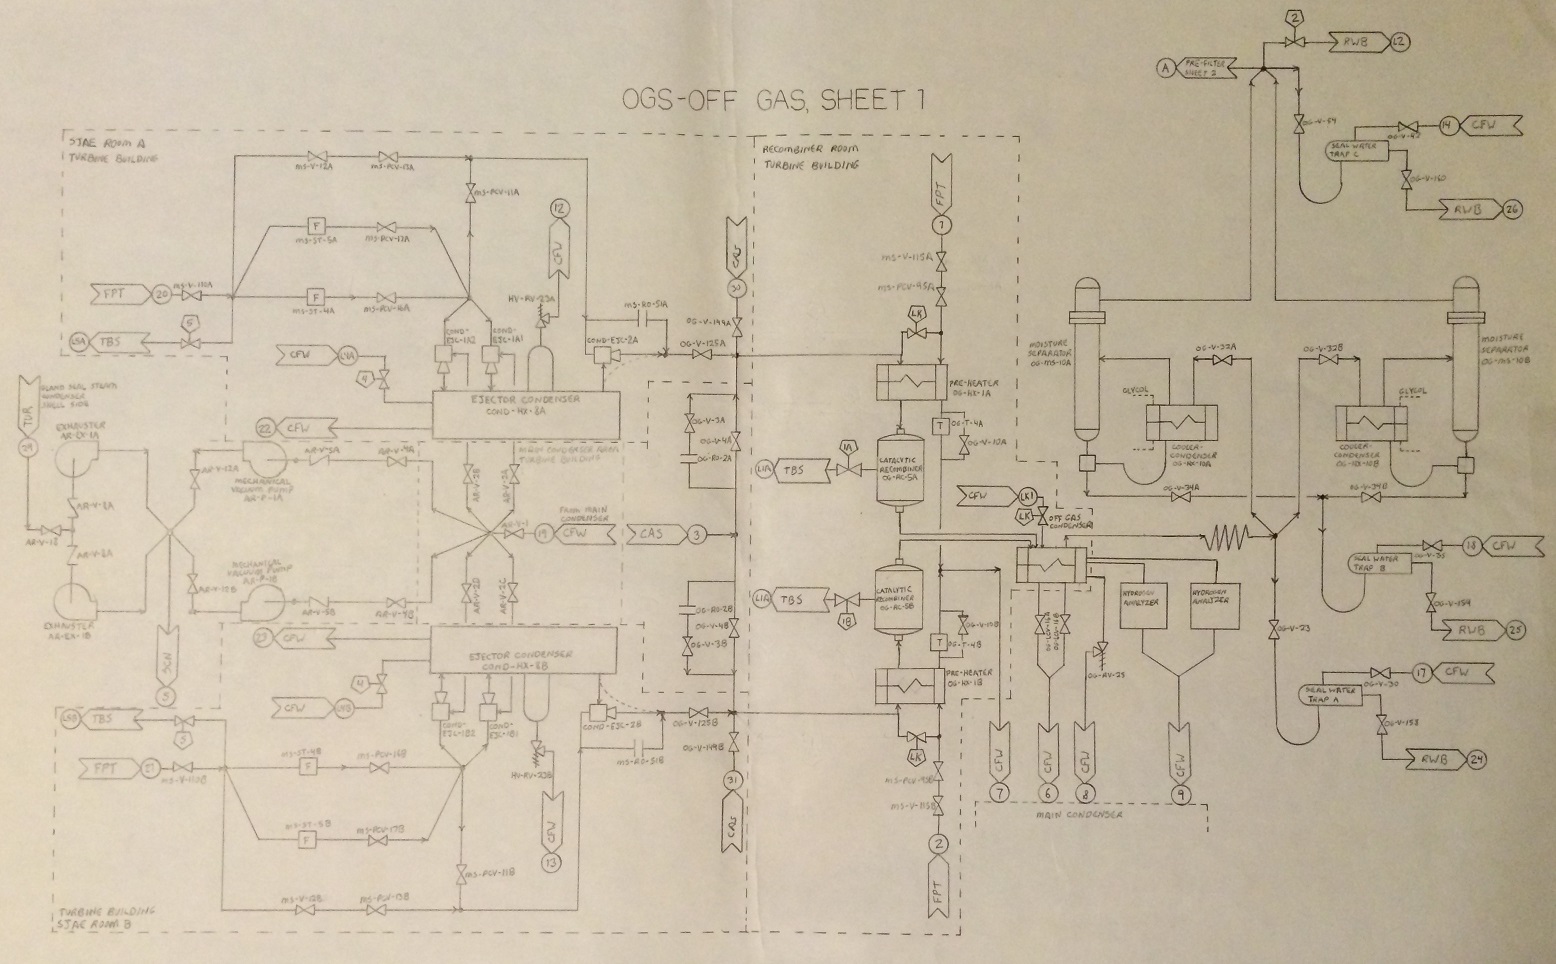
Such models can show logical and physical arrangements, and can include almost every other kind of information imaginable.
Link to detailed discussion.
State Models
Elements within systems and processes can exist in many defined states, and switch between states in response to a variety of events.
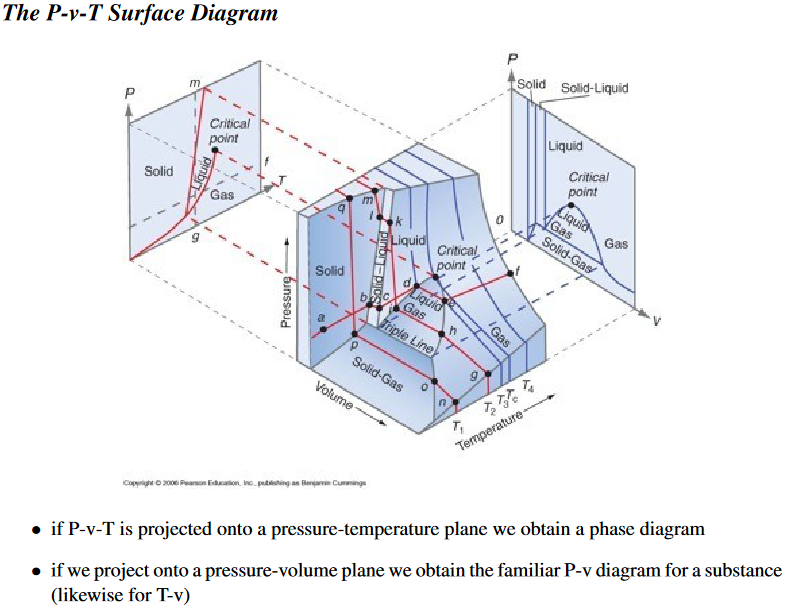
States may be defined by a single piece of information (like time) or by a combination of data items and situations.
States may have to be recalculated often.
Link to detailed discussion
Decision Models
Decision modeling and analysis involves finding out how decisions are made and potentially automating them. Decisions are being made based on higher levels of abstraction.
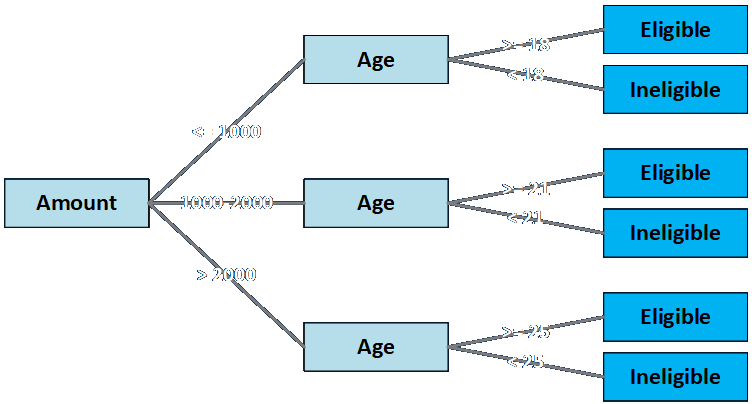
Decisions can be based on a wide variety of data and considerations, and with the involvement of people in many different roles.
Some decisions can be made deterministically, while others involve expert judgment that cannot readily be automated.
Links to detailed discussion 1 and detailed discussion 2.
Interface Analysis
Interfaces must be negotiated and designed for interactions between entities of all kinds. This involves humans with humans, humans with machines, and humans with machines. Interfaces can be spoken, visual, electronic, written, material, and mechanical (and probably more).
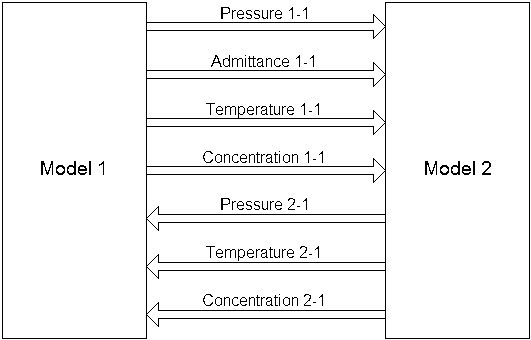

Electronic communications involve both a physical media specification and a data specification.
Understanding of all aspects of communication are of extreme importance.
Links to detailed discussion 1 and detailed discussion 2.
Data Models
Sometimes there is no substitute for describing the data elements, structures, connections, and relationships in fine and explicit detail.
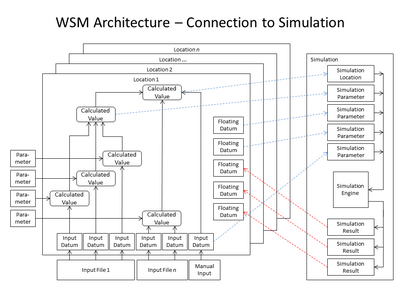
There are many ways to do this. See the bottom image of the article linked below for an example of a data model produced by a typical database program.
This is contrasted with data flow diagrams, which show how and where data moves (and potentially why). They tend to look like process models.
Link to detailed discussion.
Non-Functional Requirements
Requirements is where the needs of the organization, users, stakeholders, and solution are identified, and represents the abstract To-Be State. This process is usually iterative.
Functional
- What the system DOES
- Describes components, behaviors, entities, actions, inputs, and outputs, in ways that are usually amenable to being written in user story format.
- Contains the details of the design the user sees and the mechanisms that generate results.
Non-Functional
- What the system IS
- Describes qualities (in terms of "-ilities," e.g., reliability, modularity, flexibility, robustness, maintainability, scalability, usability, and so on).
- Describes how the system is maintained and governed.
- Describes how the system is hosted.
- Are usually NOT amenable to being written in user story format. (Because who is the actor?)
Link to detailed discussion.
Sequence Diagrams
Sequence diagrams show the order in which activities are supposed to happen. They define numerous entities in a system and the means by which messages – and often control – are passed between them.
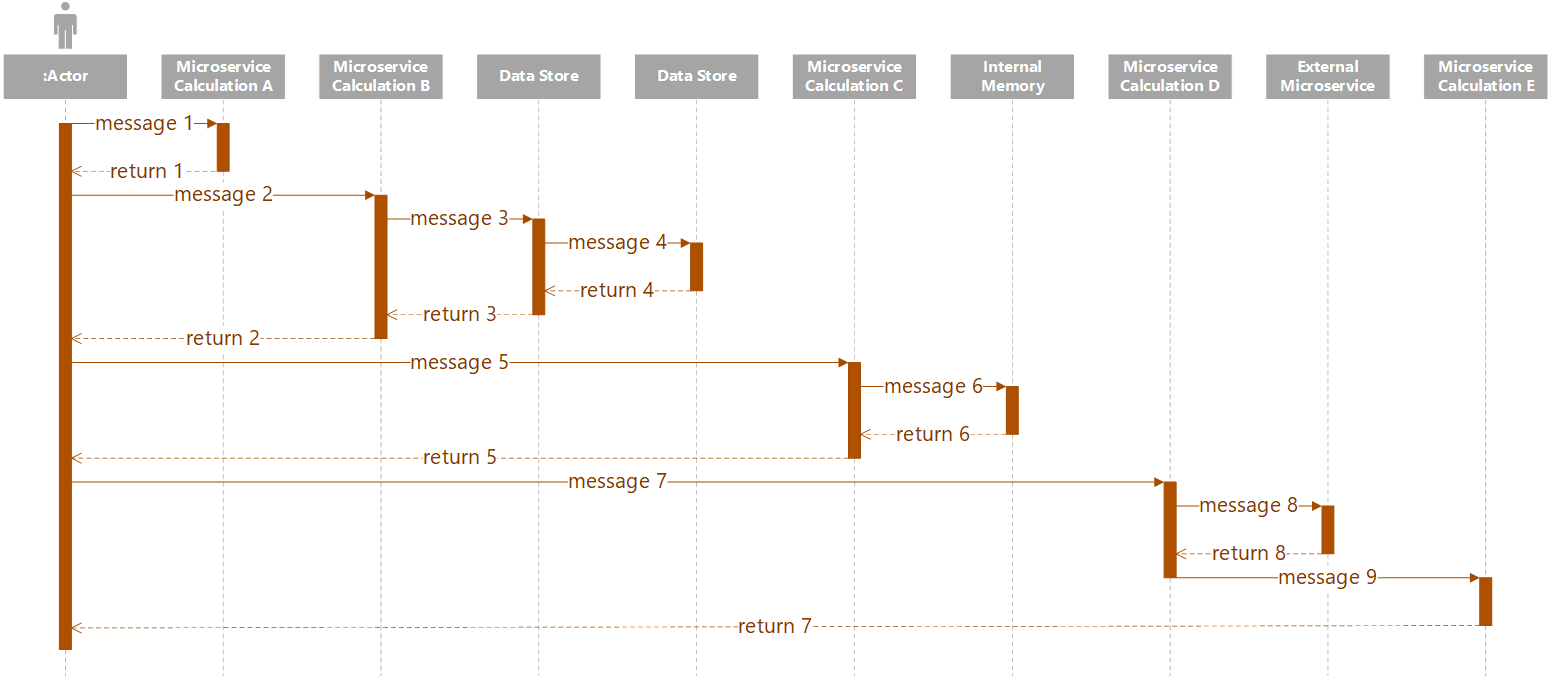
Events can be both synchronous, where the passing process must wait for the receiving process to wait until the receiving process completes (or times out) before continuing, and asynchronous, where the passing process may immediately continue without waiting for a reply.
Other complications, like alternative logical paths, may be represented.
Link to detailed discussion.
Business Rules Analysis
Business rules define fixed actions to be taken, and also the conditions under which they are taken.
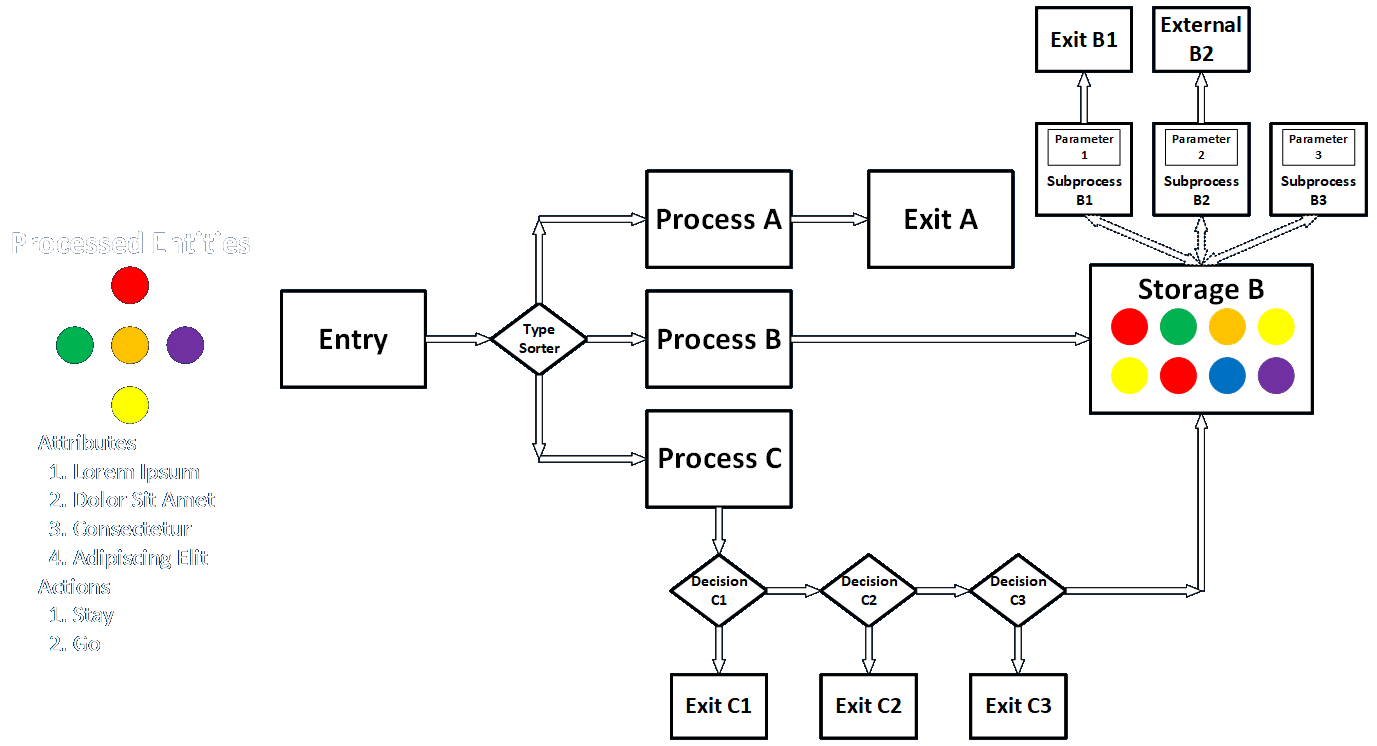
Items being processed can be sorted based on fixed and changing characteristics. If the latter, business items are typically "held" in storage and trigger actions as characteristics change (often involving time but potentially related to quantity, external states, and other factors).
Systems are often designed to define and implement business rules in a flexible and modular manner.
Link to detailed discussion.
Use Cases
Use cases describe the numerous specific steps that actors take to get things accomplished. User stories may describe the higher-level actions, but may leave the details for further development and specification.
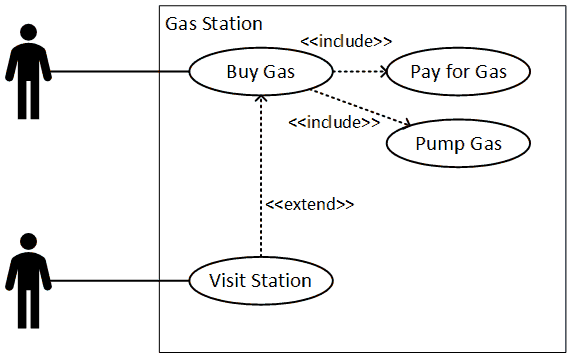

Use cases notation allows collections of steps to be bundled and reused, so they don't have to be specified in detail over and over again.
Uses cases can include other use cases as either required or optional actions.
Link to detailed discussion .
Organizational Models
Business analysis efforts can be applied to building and modifying organizations and environments, as well as processes that run within existing ones. Either way, efficient means of representing the organization and structure of such entities is needed, and that is not generally expressible in user story format.
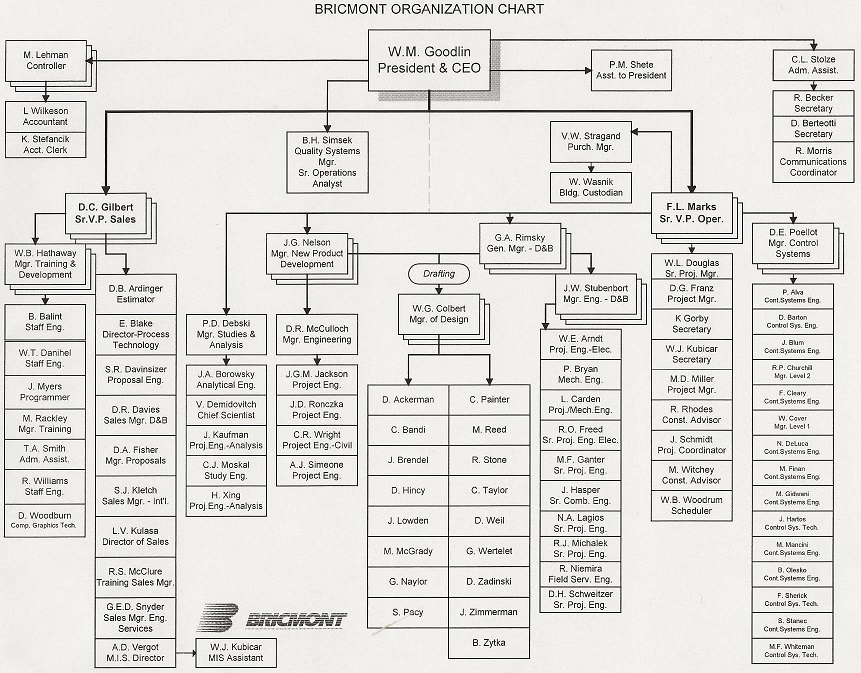
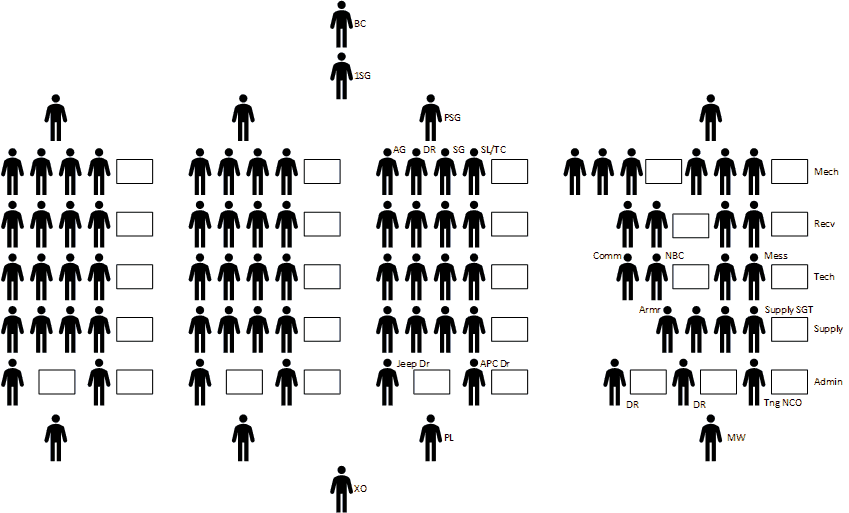
Some industries have defined ways or representing organizational elements and structure.
A wide variety of information may be included in organizational ("org") charts.
Link to detailed discussion.
Root Cause Analysis
This involves several methods of digging into a system or occurrence to understand what happened — or what might happen.
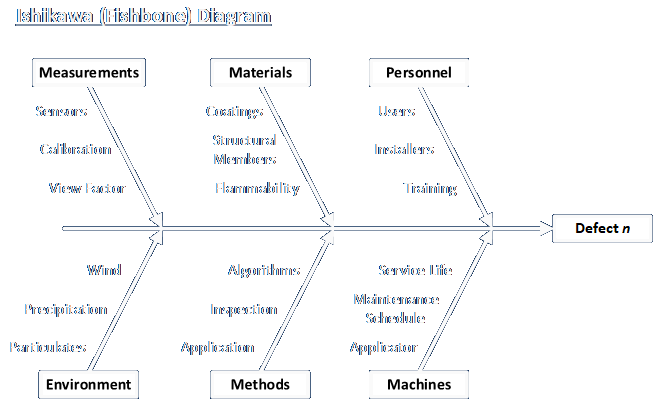
Proactive approaches include performing FMEA analysis as part of the design. (See link below.)
It can be argued that this isn't an artifact so much as a process that generates potential requirements.
Link to detailed discussion.
Additional Artifacts and Techniques
There are many more artifacts that support the description and understanding of a system and potential solutions. They all may be necessary to support writing user stories that contain enough information to allow designers and implementers to generate the results an organization or effort needs.
- Document Analysis: Description that allows understanding of data, formating, uses, context, and disposition of documents processed by and generated by an organization (Discussion)
- Data Dictionary: Listing of data elements that describe source, name, meaning, format, values, and use of data items in the system (Discussion)
- Glossary: Listing definitions of specific terms used by the organization, industry, solution type, and effort (Discussion)
- Financial Analysis: Evaluation of the monetary costs and benefits of the relevant activities and elements of an organization and its activities and potential solutions (Discussion)
- Risk Analysis: Assessment of contingencies and plans for responding to them (Discussion)
- Roles and Permissions Matrix: Description of roles in a process or organization, the actions they are permitted or empowered to take ()
- Stakeholder List, Map, or Personas: Alternative description of actors in a process or organization, often involving a RACI Matrix ()
Additional Artifacts and Techniques (continued)
These items may be useful in the course of this work, but are not derived from techniques listed in the BABOK.
- UI/UX elements, may include screen designs and other ergonomic controls
- Contract specifications (which usually aren't written in user story format), may involve requirements, service agreements with vendors and contractor and team partners, etc.
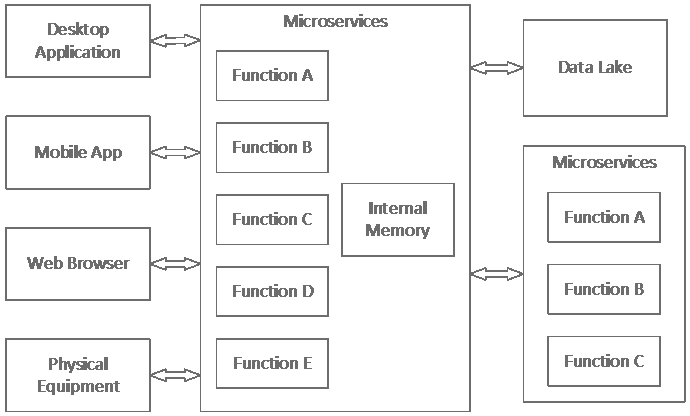
- Enterprise architecture elements, differentiating between organizational, application logic, and technology layers (Discussion)
- Details of mathematical methods
- Physical layout and location drawings (e.g., maps, floorplans, layouts, isometrics)
- Other technical diagrams (e.g., mechanical drawings, circuit diagrams, etc.)
What User Stories ARE Good For
Just because user stories aren't sufficient for everything, does not mean they aren't good for anything. They are great for expressing functional requirements at a reasonable level of detail.
Most, if not all of the artifacts described may serve as excellent accompaniments to items expressed as user stories at the top level.
The point of this exercise has been to share additional means of communicating details that enhance accuracy in communication and this shared understanding. That builds trust, cooperation, efficiency, effectiveness, and improved outcomes for everyone.
This presentation and other information can be found at my website:
E-mail: bob@rpchurchill.com
LinkedIn: linkedin.com/in/robertpchurchill