
This past weekend my CBAP training course asked me to speak briefly on the technique of Observation. I reviewed the basic information in the BABoK itself and the training guide we’re using for the class, and I’ll refer to this page for a good recap of the context for applying this technique. What was more interesting to me, and what I didn’t have time to go into during my speaking time in the session, is a discussion of the many different methods of observations I’ve actually used.
I also have the idea that the BABoK should formally include the concepts of Discovery and Data Collection to its knowledge base, and probably also the concept of Domain Knowledge Acquisition. I will write on all of these subjects in the coming days.
- Walk-throughs: These involve walking around and looking at the process to get an idea of where everything is and how it all fits together. Lean Six Sigma includes the idea of a waste walk which involves walking through an area where an operation is carried out and removing all materials which do not appear to be used in the operation. This clarifies and simplifies the environment and people’s understanding of the process. The general concept of “walking around” can be further subdivided as follows:
- Guided: A guided walk-through is one where an expert in the process (executive, manager, or SME) walks you through a process and explains what’s going on in greater or lesser details. The guide may also introduce various process SMEs that the analysis team can interact with. The first time I experienced this was at an insurance company where we were analyzing a disability underwriting process in 1993. One of the executives walked us through the various departments and had SMEs explain their processes and operations to us. We did mostly discovery, mapping, and a rough order of magnitude of timing and effort involved in all the steps because the first phase of the project only involved a business case analysis. Our work (our consultancy built document imaging systems using FileNet) yielded an analysis and proposal that won our company the right to do the system implementation later on. I also participated in large numbers of tours through airports and land border points of entry (POEs) for reasons of both explanation and security.
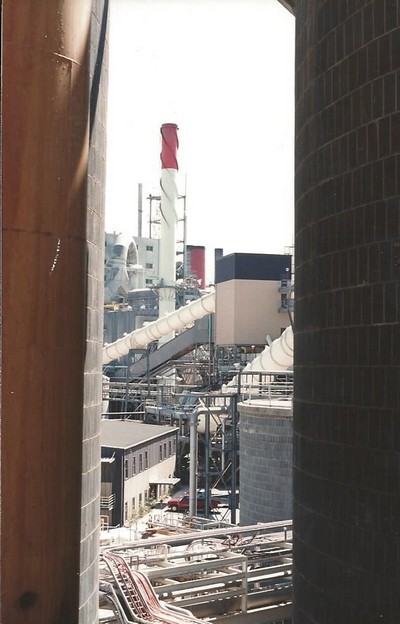
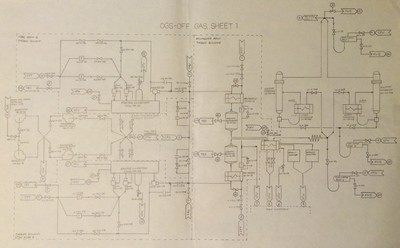
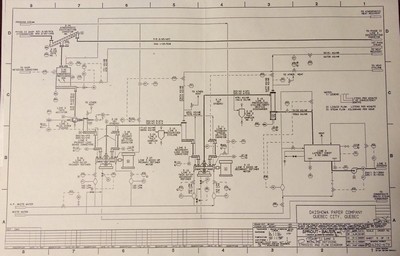
- Unguided: I’ve walked through many, many other processes without guidance to get my bearings when first arriving on site. This often happened in steel mills but also happened at smaller land POEs where we could easily figure out what was going on. In those cases we got most of our explanations from our hosts in the office or central area. When I worked in the paper industry I often walked around on my own while following the P&IDs (Process and Instrumentation Drawings, which often included heat and material balance information).
- Drawings: I described following drawings (often printed on C-sized or D-sized sheets) but there were other situations, particularly in nuclear power plants, where the drawings were the only way to see what’s happening in the process. Not only are there security issues in nuclear plants but some areas are explicitly radioactive (albeit at a very low level under normal circumstances). We got information about elevations, piping and equipment sizing, room locations, and connection to other systems all without ever seeing any of it first hand (although I did visit a control room at the WNP2 plant in Richland, WA to record the steady state readings and settings on all of the control room indicators, recorders, and controls). We got many CAD drawings of floor plans of buildings for which we built evacuation simulations and more for to-scale layouts of land border POEs.
- Internet research: I’ve gathered all kinds of information by searching the Internet. Much of that research was conducted to assess the state of the art of agent-based evacuation models (this included reviewing a number of papers from sources like IEEE and ACM) but I’ve also done such research to gauge the capabilities of competitive products and services. In many cases I’ve also used Google Earth to obtain to-scale overhead views of airports, border crossings, toll plazas, and other sites.
- Electronic Data Collection: This is an automated form of gathering data that proceeds without human intervention.
- Real-time: This type of data collection takes place “on the fly” as events occur.
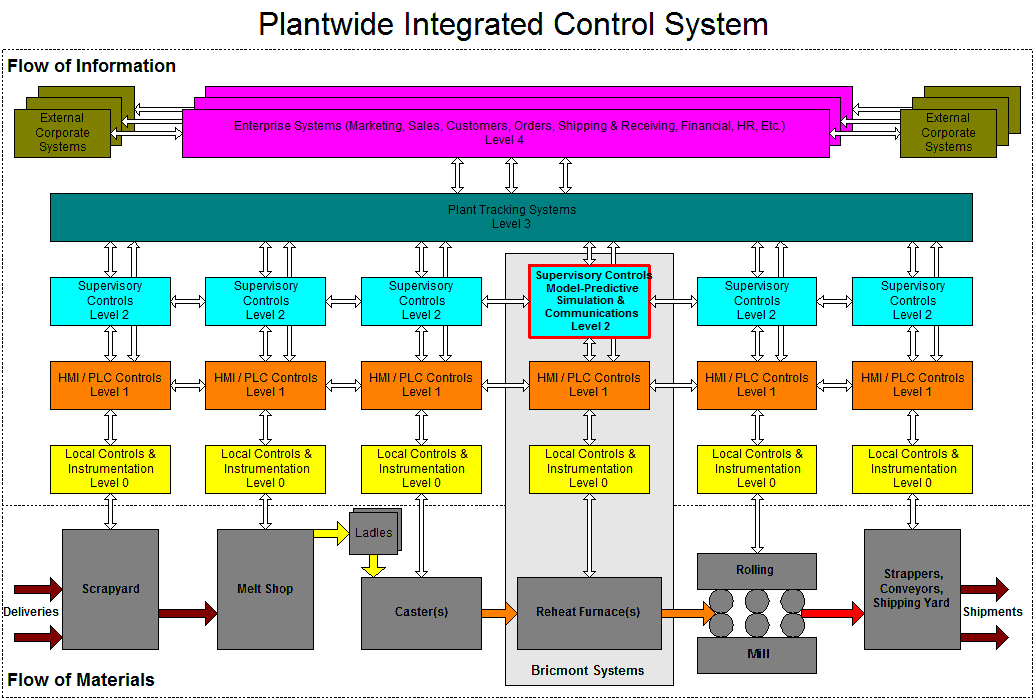
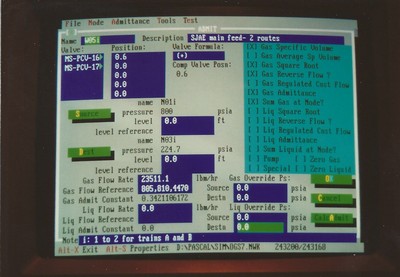
- Electronic / Instrumented: Computer systems of all kinds perform actions in response to various events. Any event that occurs can be captured for use by an internal or external process. The start, end, change of state, or problem associated with any event or process can be captured. This is true for systems that include physical sensors and processes and those that don’t. The industrial control systems I wrote for steel reheat furnaces recorded a wide variety of data. In more than one case we recorded system values for a third-party company that had an agreement with the customer that they would only be paid a percentage of money they helped the plant save in energy after they identified and implemented changes to their operations. We made files available for that company at intervals that recorded information about charge and discharge events, furnace temperatures, and fuel usage. Many of the analytic simulations I’ve written and worked with recorded key events for later statistical, ad hoc, and troubleshooting analysis.
- Physical Sensors: Sensors that detect physical events but that are not integrated into the computer or control system under observation can also be used to collect data. For example, a proximity sensor might be used to detect, timestamp, and count object passing by a certain point over time, even while this information is not incorporated into the physical or integrated control system.
- Historical: Historical data is anything recorded by or in a system that contains information about past events. Not all of the events described above will be stored or logged on a permanent or semi-permanent basis. The furnace control systems I wrote stored information about the events and operating parameters of the furnace as well as a detailed thermal history or each workpiece processed by the furnace. This information could be used in failure and quality analyses down the line. My team used decades of historical flight, maintenance, and supply data from Navy and Marine Corps databases to guide our operations research efforts. Interestingly, the data must be conditioned and cleansed beforehand because personnel on the ground (rightly, in most cases) are trained to prioritize getting the flight to go over recording the data correctly.
- Visual / In-Person: This type of observation occurs as a result of direct human action.
- Note-taking: Qualitative and quantitative observations can be recorded as notes. I have captured notes in writing, on tablets (on my iPad using a general app), and using a voice recorder for later transcription. Note that I never recorded anyone but myself. If I made recordings as part of an SME interview I did so while pausing to repeat or summarize what the SME had told me. I took several hundred such notes when collecting data on inspections as seven airports around the U.S. I later shared these with the industrial engineers who worked for the customer, who thought the information was extremely helpful. Of all the data collectors on all the teams we sent out, I was the only one who collected such notes.
- Logsheets: These are pre-formatted forms that are filled out by observers watching a process in real time. The format of the forms specifies what data is collected.
- Checklists: This is a less formal version of a logsheet.
- Mobile Apps: Logsheets can be automated to be run on mobile devices. I’ve used custom data collection apps that run on Palm and Android devices. Lines on a checksheet tend to be implemented as full screens on handheld devices, but many formats are possible.
- Interviews: Interviews are usually conducted in person but can also be done over the phone, Skype/Google Hangouts/etc., or correspondence, including by e-mail, all of which I’ve done. Interviews can be conducted as part of a walk-through or as separate activities. As noted above, I tend to record voice notes during interviews, where I repeat or summarize what I’ve been told by the SME, for written transcription later. If possible, I cycle a write-up of my findings back to the SME and other parties for review, comment, and verification.
- Surveys: Surveys can be considered a form of observation, although, like Document Analysis, the BABoK may treat it as a separate technique.
- Video: In situations where there’s too much going on to record events in person, or when the collection period is too long, video may be recorded for breakdown after the fact. I and my colleagues used this method to record inspection activities at land border crossings, airports, and other facilities. Another advantage of using this method is that a small number of people can travel to a site while a larger number of people can do the video breakdown (using checksheets, spreadsheets, or similar tool) back at the main office without incurring travel expenses. Videos can also be stored for later review. One company I worked for retained well over 1000 4-hour camcorder mini-cartridges.
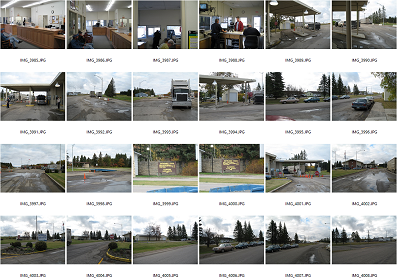
- Photographs / Pictures: I’ve taken plenty of pictures of sites for layout, context, and a jog to my memory.
- Equipment Manuals and Specifications: This type of documentation can provide incredible amounts of information to an observer. I used such materials extensively when building simulations for nuclear power plants and paper mills. This method is applicable to any type of equipment.
- Document Review and Capture: This is chiefly concerned with documents that are being handled as part of a larger process. They can be reviewed both for the specific information they contain and for the format of that information, which can guide the identification of requirements and data items.
- Calculations: Calculations may have to be performed to infer values that cannot be measured directly. I’ve performed calculations to supplement observations in many different situations, but this primarily came up when analyzing processes for which I was building continuous simulations (those defined by differential equations).
- Research: Research involves a combination of all of these methods.
- Documented Procedures and Policies: There are cases where processes are never observed directly but rather discovered through review of published procedures and policies. The NAMP (Naval Aviation Maintenance Program) describes all of the activities and parameters involved in maintaining and flying aircraft.
- Focus: Observations can be made to learn two classes of information:
- for procedures/steps (qualitative): Discovery is about learning the layout, organization, and activities of a process.
- for parameters/data (quantitative): Data Collection is about determining the operating parameters of the process.