A Simulationist’s Framework for Business Analysis: Round Two

On Tuesday I gave this talk again, this time for the IIBA’s Metro DC Chapter. Here are the results from the updated survey. The results from the first go-round are here.

List at least five steps you take during a typical business analysis effort.

Everyone uses slightly different language and definitely different steps, but most of the items listed are standard techniques or activities described in the BABOK. Remember that these are things that actual practitioners report doing, and that there no wrong answers.

Some of the BAs report steps through an entire engagement from beginning to end. Other BAs report steps only to a certain point, for example from kickoff to handoff to the developers. Some start off trying to identify requirements and some end there. Some talk about gathering data and some don’t. Some talk about solutions and some don’t.

What do you take away from these descriptions?

  1. identify stakeholders / Stakeholder Analysis
  2. identify business objectives / goals
  3. identify use cases
  4. specify requirements
  5. interview Stakeholders
  1. project planning
  2. user group sessions
  3. individual meetings
  4. define business objectives
  5. define project scope
  6. prototype / wireframes
  1. identify audience / stakeholders
  2. identify purpose and scope
  3. develop plan
  4. define problem
  5. identify objective
  6. analyze problems / identify alternative solutions
  7. determine solution to go with
  8. design solution
  9. test solution
  1. gathering requirements
  2. assess stakeholder priorities
  3. data pull
  4. data scrub
  5. data analysis
  6. create summary presentation
  1. define objective
  2. research available resources
  3. define a solution
  4. gather its requirements
  5. define requirements
  6. validate and verify requirements
  7. work with developers
  8. coordinate building the solutions
  1. requirements elicitation
  2. requirements analysis
  3. get consensus
  4. organizational architecture assessment
  5. plan BA activities
  6. assist UAT
  7. requirements management
  8. define problem to be solved
  1. understand the business need of the request
  2. understand why the need is important – what is the benefit/value?
  3. identify the stakeholders affected by the request
  4. identify system and process impacts of the change (complexity of the change)
  5. understand the cost of the change
  6. prioritize the request in relation to other requests/needs
  7. elicit business requirements
  8. obtain signoff on business requests / validate requests
  1. understanding requirements
  2. writing user stories
  3. participating in Scrums
  4. testing stories
  1. research
  2. requirements meetings/elicitation
  3. document requirements
  4. requirements approvals
  5. estimation with developers
  6. consult with developers
  7. oversee UAT
  8. oversee business transition
  1. brainstorming
  2. interview project owner(s)
  3. understand current state
  4. understand need / desired state
  5. simulate / shadow
  6. inquire about effort required from technical team
  1. scope, issue determination, planning
  2. define issues
  3. define assumptions
  4. planning
  5. communication
  6. analysis – business and data modeling
  1. gather data
  2. sort
  3. define
  4. organize
  5. examples, good and bad
  1. document analysis
  2. interviews
  3. workshops
  4. BRD walkthroughs
  5. item tracking
  1. ask questions
  2. gather data
  3. clean data
  4. run tests
  5. interpret results
  6. visualize results
  7. provide conclusions
  1. understand current state
  2. understand desired state
  3. gap analysis
  4. understand end user
  5. help customer update desired state/vision
  6. deliver prioritized value iteratively
  1. define goals and objectives
  2. model As-Is
  3. identify gaps/requirements
  4. model To-Be
  5. define business rules
  6. conduct impact analysis
  7. define scope
  8. identify solution / how
  1. interview project sponsor
  2. interview key stakeholders
  3. read relevant information about the issue
  4. form business plan
  5. communicate and get buy-in
  6. goals, objectives, and scope

List some steps you took in a weird or non-standard project.

It’s interesting to see what different people consider to be out of the ordinary. Over time they’ll find that there isn’t a single formula for doing things and that many engagements will need to be customized to a greater or lesser degree. This is especially true across different projects, companies, and industries.

I think it’s always a good idea for people involved in any phase of an analysis/modification process to be given some sort of overview of the entire effort. This allows people to see where they fit in and can build enthusiasm for participating in something that may have a meaningful impact on what they do. This can be done in kickoff and introduction meetings and by written descriptions that are distributed to or posted for the relevant individuals.

The most interesting “weird” item to me was the “use a game” entry. I’d love to hear more about that.

  • Steps:
    1. Why is there a problem? Is there a problem?
    2. What can change? How can I change it?
    3. How to change the process for lasting results
  • after initial interview, began prototyping and iterated through until agreed upon design
  • create mock-ups and gather requirements
  • describing resource needs to the customer so they better understand how much work actually needs to happen and that there isn’t enough staff
  • explained project structure to stakeholders
  • interview individuals rather than host meetings
  • observe people doing un-automated process
  • physically simulate each step of an operational process
  • simulation
  • statistical modeling
  • surveys
  • town halls
  • use a game
  • using a ruler to estimate level of effort to digitize paper contracts in filing cabinets gathered over 40 years

Name three software tools you use most.

The usual suspects show up at the top of the list, and indeed a lot of a BA’s work involves describing findings and tabulating results. There are a lot of tools for communicating, organizing, and sharing information, whether qualitative findings (nouns and verbs discovered during process mapping), quantitative findings (adjectives and adverbs compiled during data collection), graphics (maps, diagrams, charts), or project status (requirements, progress, participants, test results). A few heavy duty programming tools are listed. These seem more geared to efforts involving heavy data analysis, though Excel is surprisingly powerful in the hands of an experienced user, particularly one who also knows programming and error detection.

  • Excel (8)
  • Visio (7)
  • Word (7)
  • Jira (4)
  • Confluence (3)
  • SharePoint (3)
  • MS Outlook (2)
  • Adobe Reader (1)
  • all MS products (1)
  • Azure (1)
  • Basecamp (1)
  • Blueprint (1)
  • CRM (1)
  • database, spreadsheet, or requirement tool for managing requirements (1)
  • Doors (1)
  • Enterprise Architect (1)
  • illustration / design program for diagrams (1)
  • LucidChart (1)
  • MS Project (1)
  • MS Visual Studio (1)
  • PowerPoint (1)
  • Process 98 (1)
  • Python (1)
  • R (1)
  • requirements repositories, e.g., RRC, RTC (1)
  • Scrumhow (?) (1)
  • SQL (1)
  • Tableau (1)
  • Visible Analyst (1)

Name three non-software techniques you use most.

I was surprised that there was so little repetition here. Different forms of interviewing come up most and a couple of thoughts are expressed in different ways, but the question asked what non-software tools were used most. One might expect that people would do many of the same things, but it’s a question of how each individual looks at things from their own point of view. “Business process analysis,” for example, is a high-level, abstract concept, while other items are lower-level, detailed techniques. Again, all of these items are valid, this just illustrates how people think about doing these sorts of analyses differently, and why the BABOK is necessarily written in a general way.

  • active listening
  • business process analysis
  • calculator
  • communication
  • conflict resolution and team building
  • costing out the requests
  • data modeling
  • decomposition
  • develop scenarios
  • diagramming/modeling
  • facilitation
  • Five Whys
  • handwritten note-taking
  • hermeneutics / interpretation of text
  • impact analysis
  • individual meetings
  • initial mock-ups / sketches
  • interview end user
  • interview stakeholders
  • interview users
  • interviews
  • listening
  • organize
  • paper
  • pen and paper
  • process decomposition
  • process mapping
  • prototyping
  • requirements meetings
  • rewards (food, certificates)
  • Scrums
  • shadowing
  • surveys
  • swim lanes
  • taking notes
  • use paper models / process mapping
  • user group sessions
  • whiteboard workflows

Name the goals of a couple of different projects (e.g., automate a manual process, interface to a new client, redesign screens, etc.)

The most common goals listed were automation and improvement, which is to be expected. In fact, pretty much every item on the list represents a process improvement of some kind, which is pretty much the point of what business analysts do.

  • adhere to regulatory requirements
  • adjusting solution to accommodate the needs of a new/different user base
  • automate a manual login/password generation and dissemination to users
  • automate a manual process
  • automate a manual process, reduce time and staff to accomplish a standard organizational function
  • automate a paper-based contract digitization process
  • automate new process
  • clear bottlenecks
  • data change/update
  • data migration
  • enhance system performance
  • implement new software solution
  • improve a business process
  • improve system usability
  • improve user interface
  • include new feature on mobile application
  • increase revenue and market share
  • map geographical data
  • process data faster
  • provide business recommendations
  • reimplement solution using newer technology
  • “replat form” legacy system (?)
  • system integration
  • system integration / database syncing
  • update a feature on mobile app

I’m scheduled to give this presentation in Baltimore in a few weeks, and may have still more opportunities to do so. I’ll repeat and report new survey results after each occasion, and I’ll report the combined results as well.

I’d love to hear any observations you have on these findings and answer any questions you may have.

Posted in Tools and methods | Tagged , , , , , | 2 Comments

Applications for Simulation

Simulation can be used for many different purposes, and I wanted to describe a few of them in detail. I pay special attention to the ones I’ve actually worked with during my career. Note that these ideas inevitably overlap to some degree.

Design and Sizing: Simulation can be used to evaluate the behavior of a system before it’s built. This allows designers to head off costly mistakes in the design stage rather than having to fix problems identified in a working system. There are two main aspects of a system that will typically be evaluated.

Behavior describes how a system works and how all the components and entities interact. This might not be a big deal for typical or steady-state operations but it can be very important when there are many variations and interactions and when systems are extremely complex. I’ve done this for many different applications, including iteratively calculating the concentration of chemicals in a pulp-making process, analyzing layouts for land border crossings, and examining the queuing, heating, and delay behavior of steel reheat furnaces.

Sizing a system involves ensuring that it can handle the desired throughput. For continuous or fluid-based systems this may involve determining the diameter of pipes and this size of tanks and chests meant to store material as buffers. For a discrete system like a border crossing there has to be enough space to move and queue.

The number of parallel operations for certain process stages needs to be determined for all systems. For example, if a pulp mill requires a cleaning stage and the overall flow is 10,000 gallons per minute but the capacity of each cleaner is only 100 gallons per minute then you’ll need a bank of at least 100 cleaners. That’s a calculation you can do without simulation, pr se, but other situations are more complex.

If an inspection process needs to have a waiting period of no longer than thirty minutes and the average inspection time is two minutes (but may vary between 45 seconds and 20 minutes) and there are 30 arrivals per hour, then how many inspection booths do you need? There’s not actually enough information to know. The design flow in a paper mill can be known but the arrival rate at a border crossing may vary by time of day, time of year, weather, special events, the state of the economy, and who knows how many other reasons. The size of a queue that builds up over time is based on the number of arrivals exceeding the inspection rate over a period of time. That’s not something you can predict in a deterministic way, which is why Monte Carlo techniques are used.

It’s also why performance standards (also known as KPIs or MOEs for Key Performance Indicators or Measures of Effectiveness) are expressed with a degree of uncertainty. The performance standard for a border crossing might actually be set as thirty minutes or less 85% of the time.

Operations Research is sometimes also known as tradespace analysis (see the first definition here), in that it attempts to analyze the effect of changing multiple, tightly linked, interacting processes. When I did this for aircraft maintenance logistics we included the effects of reliability, supply quantities and replenishment times, staff levels, scheduled and unscheduled maintenance procedures, and operational tempo. That particular simulation was written in GPSS/H and is said to be the most complex model ever executed in that language.

Real-Time Control systems take actions to ensure that a measured quantity, like the temperature in your house, stays as close as possible to a target or setpoint value, like the setting on your thermostat. In this example we say the system is controlling for temperature and that temperature is the control variable. In most cases the control variable can be measured directly, in which case you just need a feedback and control loop that looks at the value read by a mechanical or electrical sensor. In some cases, though, the control variable cannot be measured directly, in which case the control value or values have to be calculated using a simulation.

I did this for industrial furnace control systems using combustion heating processes and induction heating processes. Simulation was necessary for two reasons in these systems. One is that the temperature inside a piece of metal cannot be measured easily or cost-effectively in a mass-production environment, so the internal and external temperatures through each workpiece were calculated based on known information, including the furnace temperature, view factors, thermal properties of the materials including conductivity and heat capacity (which themselves changed with temperature), dimensions and mass density of the metal, and radiative heat transfer coefficients. The temperature was calculated for between seven and 147 points (nodes) along the surface and through the interior of each piece depending on the geometry of the piece and the furnace. This allows for calculation of both the average temperature of a piece and the differential temperature of a piece (highest minus lowest temperature). The system might be set to heat the steel to 2250 degrees Fahrenheit on average with a maximum differential temperature of 20 degrees. This was done so each piece was known to be thoroughly heated inside and outside before being sent to the rolling mill.

Training using simulation comes in many forms.

Operator training involves interacting with a piece of equipment or a system like an airplane or a nuclear power plant. I trained on two different kinds of air defense artillery simulators in the Army (the Roland and the British Tracked Rapier). More interestingly I researched, designed, and implemented thermohydraulic models for full-scope nuclear power plant training simulators for the Westinghouse Nuclear Simulator Division. These involved building a full-scale mockup of every panel, screen, button, dial, light, switch, alarm, recorder, and meter in the plant control room. Instead of being connected to a live plant it was connected to a simulation of every piece of equipment that affected or was affected by an item the operators could see or touch. The simulation included the operation of equipment like valves, pumps, sensors, and control and safety circuits; fluid models that simulated flow, heat transfer, and state changes; and electrical models that simulated power, generators, and bus conditions.

Participatory training involves moving through an environment, often with other participants. One company I worked with built evacuation simulations which were later modified to be incorporated into multi-player training systems for event security and emergency response. I defined the system and behavior characteristics that needed to be included and designed the screen controls that allowed users to set and modify the parameters. I also wrote real-time control and communication modules to allow our systems to communicate and integrate with partner systems in a distributed environment.

Risk Analysis can be performed using simulations combined with Monte Carlo techniques. This provides a range of results across multiple runs rather than a single or point result, and allows analysis of how often certain events occur relative to a desired threshold, expressed as a percentage. I’ve done this as part of the aircraft support logistics simulation I described above.

Economic Analysis may be carried out by adding cost factors to all relevant activities, multiplying them by number of occurrences, and totaling everything up. Note that economic effects can only be calculated for processes that can truly be quantified. Human action in unbounded activities can never be accurately quantified, both because humans have an infinite number of choices and because it would be impossible to collect data if all possible activities could be identified, so simulation of unbounded economies and actors is not possible. Simulating the cost of a defined and limited activity like an inspection or manufacturing process is possible because the possible actions are limited, definable, and collectable. I built this feature directly into the system I created for building simulations of medical practices.

Interestingly, cost data can be hard to acquire. This is understandable in the case of external cost data but less so from other departments within the same organization. Government departments are notorious for protecting their “rice bowls.” Employee costs are another sensitive area. They can be coded or blinded in some way, for example by dividing all amounts by a set factor so relative costs may be discerned but not absolute costs. Spreadsheets containing occurrence counts with costs left blank can be provided to customers or managers to fill out and analyze on their own.

Impact Analysis involves the assessment of changes in outcomes resulting from changes to inputs or parameters. Many of the simulations I’ve worked with have been used in this way.

Process Improvement (including BPR) is based on assessing the impacts of changes that make a process better in terms of throughput, loss, error, accuracy, cost, resource usage, time, or capability.

Entertainment is a fairly obvious use. Think movies and video games.

Sales can also be driven by simulations, particularly for demonstrating benefits. Simulations can also show how things work in a visually, which can be impressive to people in certain situations.

Funny story: One company did a public demo of a 3D model of a border crossing. It was a nice model that included some random trees and buildings around the perimeter of the property for effect. Some of the notional buildings were houses that weren’t intended to be particularly accurate as far as design or placement. A lady viewing the demo said the whole thing was probably wrong because her house wasn’t the right color. She wouldn’t let it go.

You never know what some people will think is important.

Posted in Tools and methods | Tagged , | Leave a comment

Architectural Considerations for Simulation

The simulations I’ve written, designed, specified, and utilized have incorporated a number of different features. I found it interesting that I was able to describe them in opposing pairs.

Continuous vs. Discrete-Event

I’ve gone into detail about continuous and discrete-event simulations here and here, among other places, so I won’t go into major detail now. I will say that continuous simulations are based on differential equations intergrated stepwise over time. They tend to run using time steps of a constant size. If multiple events occur in a given time interval they are all processed at once during the next execution cycle. Discrete-event simulations process events one-by-one, in time order, and in intervals of any duration. They can also handle wait..until conditions. Hybrid architectures are also possible.

Interactive vs. Fire-And-Forget

Interactive simulations can accept inputs from users or external processes at any time. They can be paused and restarted, and can sometimes be run at multiples or fractions of the base speed. Examples of interactive simulations are training simulators, real-time process control simulations, and video games.

Non-Interactive or Fire-and-Forget simulations typically run at one hundred percent duty cycle for the fastest possible completion. This type of simulation is generally used for design or analysis.

Real-Time vs. Non-Real-Time

Real-Time systems include wait states so they run at the same rate as time in the real world. This means that the code meant to run in a given time interval absolutely must complete within the time allotted for that interval.

When a control system I wrote for a steel furnace in South Caroline started throwing alarms for not keeping up I used the Performance Monitor program in Windows to determine that a database process running on the same machine would consume all the execution time for a couple of minutes a couple of times a day. This prevented the simulation from running at full speed which would have caused unwanted calculation and event-handling errors. I ended up being able to install the control code on a different system where it didn’t have to compete for resources.

Non-Real-Time systems can run at any speed. Fire-and-forget systems tend to run at full speed using all available CPU resources. Interactive simulations may run faster or slower than real-time. The computer game SimCity, for example, simulates up to 200 years of game activity in a few tens of hours of game play. Scientific simulations of nano-scale, physical events may simulation a few microseconds of real activity over dozens of hours of computing time.

Single-Platform vs. Distributed

Single-Platform simulations run on a single machine and a single CPU. This is typical of single-threaded desktop programs.

Distributed systems run across multiple CPUs or multiple machines. This arrangement invokes an overhead of communication and synchronization. I’ve written codes for several kinds of distributed systems.

The first time I encountered a multi-processor architecture was for the nuclear plant trainers hosted on Gould/Encore SEL 32/8000-9000 series computers. These systems featured four 32-bit CPUs that all addressed (effectively) the same memory.

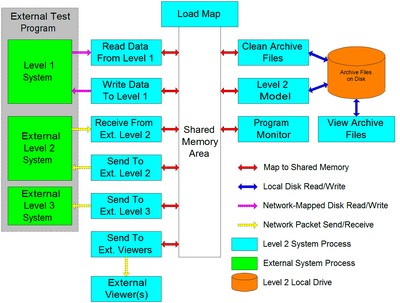
The next time was for the real-time control systems I wrote for industrial furnaces for the metals industry. They included two different kinds of distributed processing. One involved running multiple processes on a single, time-slicing CPU, that communicated with each other using shared memory. In some ways that was like using the Gould/Encore systems. The other kind of distributed processing involved communicating with numerous other computing systems in the plant, at least one of which was itself a simulation in some cases. This kind of architecture employed many different forms of inter-process communication. The diagram below describes this kind of system, which I implemented on VMS and Windows systems.

I wrote the communication code that integrated an interactive evacuation system with a larger threat detection and mitigation system written by other vendors. It used interface techniques similar to those described above.

I did the same thing for the integration of another evacuation simulation using the HLA or High-Level Architecture protocol. This technique is often used to integrate multiple weapons simulators into a unified battlefield scenario.

Deterministic vs. Stochastic

Deterministic simulations always generate the same outputs given the same inputs and parameters. They are intended to provide point results. The thermal and fluid simulation systems I wrote were all deterministic.

Stochastic simulations incorporate random elements to generate probabilistic results. If numerous iterations are run this type of simulation will generate a distribution of results. Monte Carlo simulations are stochastic.

Posted in Simulation | Tagged , | Leave a comment

Verification and Validation: Observations for Simulation and Business Analysis

Verification and validation are complex subjects on their own (and see here and here more specifically for this discussion), and the simplest way I’ve found to describe the difference between them is that verification tests whether a solution works while validation tests whether a solution solves the problem.

Verification is the process of testing whether the system (software or otherwise) works without generating run-time errors, or at least that it’s able to handle and recover from errors. Individual operations can be verified formally by mathematical proof and informally through manual or automated testing. These can include send/receive operations, read/write operations (a subset of send/receive), calculations, branching and call operations, and user interface activities.

Validation in general is the process of testing whether the system (again, software or otherwise) is fit for its intended use, whether it meets the business need.

For simulation the idea of validation has two meanings. One is that the simulation itself accurately recreates observed behaviors for known cases. This gives confidence that it will produce accurate behaviors in novel cases. This is a subset of the test for whether the simulation then fulfills its intended use. Potential intended uses of simulations are described in detail here, but examples include design, real-time control, and training.

For business analysis the above discussion applies for computer-based systems and non-computer-based systems as normal. The BABOK (see also here), however, applies the terms not to software systems or systems in general, that business analysts work with, but to requirements. It gives the following definitions (page 134 of the 3rd ed.):

Verify Requirements: ensures that a set of requirements or designs has been developed in enough detail to be usable by a particular stakeholder, is internally consistent, and is of high quality.

Validate Requirements: ensures that a set of requirements or designs delivers business value and supports the organization’s goals and objectives.

These definitions definitely have the same character as those discussed above. They say that verification is about whether the requirements are usable in a way that will get something working, while validation is about whether the working solution provides the intended value.

I would argue that the BABOK’s wording could be more precise along these lines. The biggest problem I have is with the idea of “high quality,” which is nebulous and undefined. Quality, according to Philip B. Crosby, in his book Quality Is Free asserts that quality means meeting the established requirements. This definition implies that requirements have be be defined in a way that can be tested on an objective, pass/no-pass basis. (Subjective enterprises like art cannot be judged in this way, although its components can be.) I was introduced to this book during my first job in 1989, when the company was introducing the then-current ideas of Total Quality Management. I think these ideas have been subsumed by the ideas of Lean Six Sigma, although the Wikipedia article suggests that its ideas were more directly supplanted by ISO 9000, which a later company I worked for adopted in the late ’90s.

I propose that the BABOK definitions be reworded as follows:

Verify Requirements: ensures that a set of requirements or designs is internally consistent and has been developed in enough detail to support the implementation of a working system.

Validate Requirements: ensures that a set of requirements or designs supports the implementation of a working system that delivers business value and supports the organization’s goals and objectives.

This emphasizes that the requirements and designs need to lead to something concrete, but doesn’t demand that the implementation has been carried out before the verification and validation can be completed.

Posted in Tools and methods | Tagged , , , , , , | Leave a comment

A Simulationist’s Framework for Business Analysis: Round One

Yesterday I gave my newly prepared talk on business analysis at the Pittsburgh IIBA Chapter Meetup, the first of three times I’m scheduled to give it. The presentation, prepared using the Reveal.js framework, is at the link:

http://rpchurchill.com/presentations/SimFrameForBA/

I’m sure the snow limited the turnout but it was still fun to do, and good practice. The talk covers the latest update to my analysis framework I’ve described previously here and here. I’ve changed the terminology to refer to the process steps rather than the documents produced during each step. The current listing is:

Project Planning
Intended Use (Identify or Receive Business Needs)
Assumptions, Capabilities, and Risks and Impacts
Conceptual Model (As-Is State)
Data Sources
      –Requirements (To-Be State: Abstract)
      –Functional (What it Does)
Non-Functional (What it Is, plus Maintenance and Governance)
Design (To-Be State: Detailed)
Implementation
Test
      –Operation and Usability (Verification)
      –Outputs (Validation)
Acceptance (Accreditation)
Project Closeout

I tried to get the audience a bit involved, beyond the normal interactions and questions during the talk, by asking the audience to fill out a brief survey before I started. It asked four things, in one-to-three-word answers:

  • List 5-8 steps you take during a typical project.
  • List some steps you took on a weird or non-standard project.
  • Name three software tools you use most.
  • Name three non-software techniques you use most.

I asked a few audience members to read off their steps in answer to the first question. When I heard their answers I realized I had slightly mis-worded the question, because many of them described the steps of a project and not an analysis. There is admittedly an overlap, but since this is a talk about business or process analysis I was trying to get them to talk about that. I will therefore change the wording of the first survey item to: “List 5-8 steps you take during a typical analysis effort.” I’ll reword the second item in the same way, as well. As I think about it I’m also going to add: “List the goals of some efforts for which you performed analysis.”

I’ll report the findings from later talks when they happen, but here are the responses from the sheets I was able to collect:

List 5-8 steps you take during a typical project.

  1. Requirements Gathering
  2. Initiation
  3. Testing
  4. QA
  5. Feedback
  6. User acceptance
  1. Requirement Elicitation
  2. UX Design
  3. Software Design for Testability
  1. Identify Business Goal
  2. ID Stakeholders
  3. Make sure necessary resources are available
  4. Create Project Schedule
  5. Conduct regular status meetings
  1. Meet with requester to learn needs/wants
  2. List details/wants/needs
  3. Rough draft of Project/proposed solutions
  4. Check in with requester on rough draft
  5. Make edits/adjustments | test
  6. Regularly schedule touch-point meeting
  7. Requirement analysis/design | functional/non-functional
  8. Determine stakeholders | user acceptance
  1. List the stakeholders
  2. Read through all documents available
  3. Create list of questions
  4. Meet regularly with the stakeholders
  5. Meet with developers
  6. Develop scenarios
  7. Ensure stakeholders ensersy requirements
  8. other notes
    • SMART PM milestones
    • know players
    • feedback
    • analysis steps
    • no standard

List some steps you took on a weird or non-standard project.

  • Made timeline promises to customers without stakeholder buy-in/signoff
  • Regular status reports to CEO
  • Adjustments in project resources
  • Travel to affiliate sites to understand their processes
  • Developers and I create requirements as desired
  • Write requirements for what had been developed

Name three software tools you use most.

  • Excel (3)
  • Notepad (2)
  • SQL Server (2)
  • Email
  • Visual Studio (MC)
  • NUnit
  • Team Foundation Server
  • OneNote
  • Word
  • MS Office
  • ARC / Knowledge Center(?) (Clint Internal Tests)
  • Enbevu(?) (Mainframe)

Name three non-software techniques you use most.

  • Elicitation
  • Communication
  • Documentation
  • Recognize what are objects (nouns) and actions (verbs)
  • Responsibility x Collaboration using index cards
  • Scrum Ceremonies
  • 1-on-1 meetings to elicit requirements
  • Spreadsheets
  • Meetings
  • Notes
  • Process Modeling
  • Fishbone Diagram
  • Lists

The point of the survey was to illustrate that different analysts use the same basic techniques but don’t always apply them in the same order or the same way. It therefore makes sense that the BABOK’s concepts are organized and presented in a rather general way. This became clear to me as I was preparing materials for this talk. The BABOK material was really easy for me to learn because I’d essentially seen it all before. It wasn’t until I tried to map its content, in terms of its six major knowledge areas, to the steps of my framework. You can see this in the slide titled “BABOK Knowledge Areas vs. Bob’s Framework.” It roughly goes from upper left to lower right, so that’s good, but the devil is in the details.

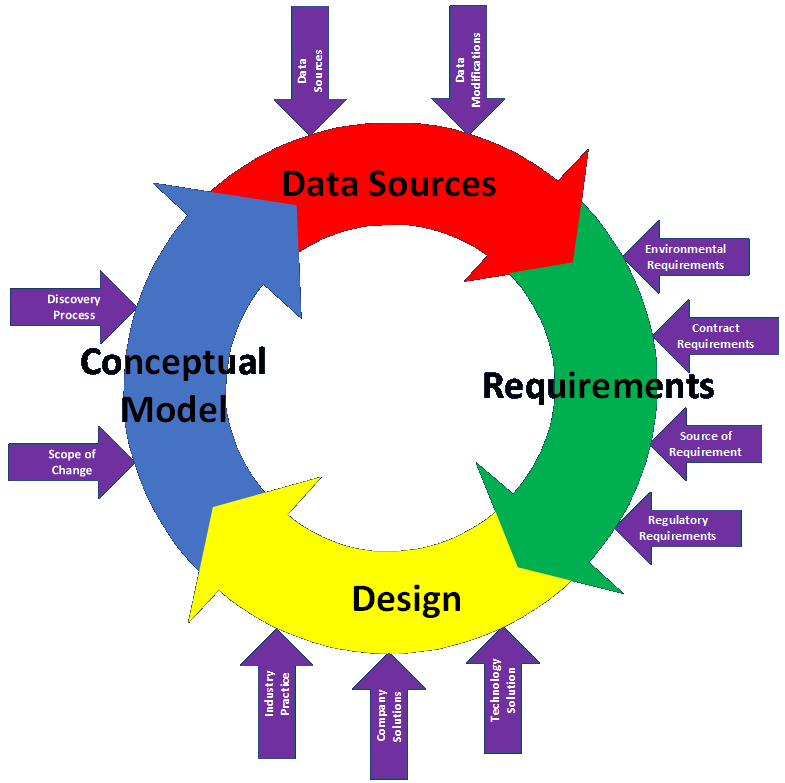
The biggest confusion is in the middle steps, Conceptual Model, Data Sources, Requirements, and Design, though I also differentiate between primary mappings (with bold, capital X’s) and secondary mappings (with grayed, lower-case x’s). The problem further extends into the Implementation step, which involves elements from all six BABOK knowledge areas to a greater or lesser degree. I ended up creating a slide that illustrated the complexity of the Concept-to-Design cycle to illustrate this, and this is not intended to convey the same idea as the later slide that shows how every step should be reviewed with the customer until agreement or acceptance and that newly identified elements may require the creation of a new source element in the previous step.

Clarification: Conceptual Model through Design

Customer Feedback Cycle

The steps I’ve developed grew out of my specific experience doing simulations of many different kinds. I’m going to write supporting blog posts for many of the slides and adding links to them from the slides and the accompanying PDF file of them. Look for them in the coming weeks.

In the meantime I’m really looking forward to gathering more data during future talks and reporting on it here. Stay tuned!

Posted in Tools and methods | Tagged , , , , , | Leave a comment

Who’s the Boss?

An interesting subject came up at the post-presentation hangout of this evening’s CharmCityJS Meetup. I was talking with a fellow attendee about the fact that I’d rather be an analyst, requirements engineer, and architect than a full-time coder (not that I don’t want to be deeply involved with said code, even to the point of helping write and automate it) while he had transitioned back to being a full-time developer from being an analyst and architect.

For him the sweet spot was in the implementation, and he never liked the push and pull of his charges and his bosses providing their inputs into and feedback about his designs. He felt that the inputs coming up and down to him conflicted often enough that he could rarely make everyone happy.

My thought is that I want to be analyzing and engineering requirements to address the needs of the customers (external and internal), and meet the needs of the bosses. My thought about making the developers happy, and this came up in a conversation I had with another insightful individual last week, is based on writing the requirements in such a way that the developers have maximum leeway (subject to company policy, tooling, and so on) to give me what I want in the way they want. The way to do that is to write the requirements at a high enough level of abstraction that they can use a lot of different hows but I can’t help but get my what.

I can comment almost endlessly here. To begin, how does one describe this level of abstraction ahead of time? The answer, of course, is that one can’t, really. You just have to have a feel for it on a case by case basis. I know what you can’t do, though.

At the last Baltimore chapter IIBA meeting someone gave a presentation on a requirements authoring tool. It was a flowcharting program with a lot of automated analysis and testing functionality that could be used to represent a design at any level of abstraction. The speaker worked through the demo at a level of detail that was very close to writing the code. I suppose some organizations may want to work that way (bigger companies may have the mindset that they want to pre-specify as much as possible so each part of the value-added chain has the least leeway and can thus make the fewest mistakes), but that methodology didn’t sit right with me. I’ve never written requirements that way unless I’ve been asked to write out specific algorithms or calculations.

Remember that the analyst/engineer/architect is going to be working with the developers in an iterative, cooperative way so they can both provide their best inputs into the solution. I have some pretty strong ideas about things sometimes but I’m not going to just fling work requests over the transom to the next group and expect my wishes to be fulfilled exactly without interaction. Not only is the interaction better for the product and project at hand in the short term, but it’s better for understanding, camaraderie, respect, education, and — dare I say it — fun, in the longer term. Working this way with customers should be a given, and one always hopes to be able to work with bosses in the same way.

The insight from the conversation was that everyone has a boss. Richard Branson and Bill Gates have bosses. They’re called customers, and they’re ultimately the most demanding bosses of all. The question is about how you like to receive and process your “orders” (from all directions, and again, internally and externally) and how much leeway you have to fulfill them.

The fellow I talked with didn’t like to receive his orders the way they came in his role as an analyst and architect, but he does like receiving them as a developer. I can go either way, given the right style of communication and the right environment, but at this point my passion is to make things easier at the sweet spot where I think I can do the most good. I think serving in the analyst/engineer/architect role allows me to shape the interactions in all directions to provide the most effective, cooperative, productive environment possible. This is based on my experience serving in many roles in the SDLC and as a manager/mentor and subordinate/mentee, and the success I’ve had in identifying, implementing, and delivering effective solutions.

Now I wonder if my companion might have preferred his original role if the communication or environment had been different. I’ll try to remember to ask him next month. Until then I’ll be thinking about how I can create the best communication and environment I can no matter what I’m doing, which has been my true mission for the last few years, if not longer. Getting the technical part right is usually much easier than getting the people part right.

Posted in Management | Tagged , , | Leave a comment

Service Design

Manning the phone in the battery headquarters late one night in Basic Training I wiled away some time with a book I found. I read how Colonel Chamberlain’s extensive drilling of his men allowed them to execute a wheel maneuver in pitched combat that resulted in the successful defense of Little Roundtop at the Battle of Gettysburg. I also read about Napoleon giving his men campaign awards as a source of motivation observing, perhaps cynically, that “A soldier will fight long and hard for a bit of colored ribbon” and “Give me enough ribbons to place on the tunics of my soldiers and I can conquer the world.”

What these events have in common is the recognition that individuals respond to incentives and that positive, reward-based incentives lead to better outcomes. Chamberlain and Napoleon were effective leaders and process designers who knew how to instill confidence and satisfaction that would survive under extreme stress. Compared to the horrors of combat, keeping customers happy, informed, incentivized, and engaged while buying a fancy coffee ought to be a piece of cake, right?

Along these lines at this evening’s IIBA Pittsburgh Chapter Meetup, Jean-Marie Sloat discussed a field called Service Design. I’ll link to her presentation when it’s posted but for now I wanted to report that the content was extremely interesting, especially regarding the technique of Customer Journey Maps. It involved many of the concepts I’ve used in my own career as a process analyst, business analyst, and process improvement specialist. My formal training in Project Management, Lean Six Sigma, and Business Analysis (and even Scrum and Agile, which feel like more limited disciplines) overlapped across many of the same ideas, and Service Design seems to do the same thing. Indeed, it is known as being very cross-disciplinary. The disciplines the field sees itself as touching on or including are:

  • Systems Thinking
  • Design Research
  • Business Modeling & Strategy
  • Prototyping
  • Multi-disciplinary (this is more of description than a field, no?)
  • Design
  • Facilitation
  • Visual Design

The talk was really interesting to me because I could see my concerns, techniques, and emphases underlying everything Ms. Sloat described, and those considerations are doubtless addressed by her and her colleagues in the course of their work, but they were not her main area of concern, at least for the purpose of her talk. Her concentration, beyond the many interesting tools she described (that I plan to write about shortly and that will make this idea really pop), was on the emotions and reactions of participants in a process. She noted that she’s a fairly empathetic person and listening to and addressing the needs of people is an important part of her m.o..

I usually try to analyze a process by approaching it like a simulation, and for typical processes involving people and businesses this means discrete-event simulation. Whether a simulation is actually going to be built and run is immaterial, the analysis starts by mapping out flows of material and information in a process, including states, decisions, calculations, transformations, routings, and so on. Six Sigma improvements usually involve some combination of reducing variation, improving centering in a range, root cause analysis, and prevention of errors. Lean improvements usually involve a combination of compression, rearrangement, automation, and elimination.

It’s easy to imagine such techniques yielding improvements in bloodlessly technocratic measures like cycle time, loss and rework percentage, readiness, and cost savings. The question is whether any of these indicators reflect the emotions of the participants in terms of satisfaction, stress, abandonment of the process, shortcutting the process, or generating positive or negative referrals. The question is also whether these factors are considered when identifying the need for change in the first place.

I mentioned earlier that Service Design approaches the same problems as other groups of techniques but does so from a slightly different viewpoint, which is analogous to the way UML analysis drives you to examine computer systems from multiple viewpoints. If all of the techniques of UML are used you’re at least likely to consider a wide range of factors. This is no guarantee that you won’t do anything wrong, but such frameworks provide an organized way to make sure you’re being thorough. This seems to be a characteristic of many formalized bodies of knowledge. My feeling, after reflecting on tonight’s material, is that traditional techniques do, indeed, consider the emotions and reactions and well-being of process participants both as drivers and output measures of improved operations.

  • My Six Sigma training included the Kano Model, the Likert Scale, and probably others I can’t remember away from my notes and references. These deal specifically with the needs and desires of customers.
  • I’ve certainly designed user interfaces to improve control, understanding, and situational awareness, which results in improved confidence, efficiency, and even safety of users and other parties. This deals with the needs of providers.
  • Establishing measures of effectiveness (MOEs) in terms of maximum wait times is certainly about customer well-being.
  • Asking what people want and need must consider their emotions and needs at various levels (I learned about Maslow’s Hierarchy of Needs when I was in Junior Achievement in high school, so I’ve essentially always been aware of this).
  • Having managers take suggestions from workers is an example of this.
  • Paying people based on production or profits and not just hours worked takes emotions, well-being, and incentives into account pretty directly.
  • A Total Quality Management (TQM) consultant I met in the mid-90s described how Ford Motor Company’s motto, “Quality is job one” was doubly effective because it not only reassured customers but also motivated Ford’s workers at all levels.

Indeed, most, if not all, process improvements are about making people’s lives better in some way.

We engineers and process analysts may seem dry, removed, technical, and unresponsive, particularly when we’re doing something geeky, complicated, and opaque that involves computers, but we’re ultimately trying to help people. Considering things from the viewpoint of Service Design may be a way to be thorough, to relate to the people we’re trying to help in a way that they “get.” You know. Emotionally.

Posted in Tools and methods | Tagged , , | Leave a comment

Ship Technology from the Late 1500s

Today I visited a historical exhibit on Roanoke Island in the Outer Banks of North Carolina. The most interesting part of the park was the Elizabeth II, a replica modeled after the late-1500s sailing ships used to bring colonists and explorers to the New World.

People have an idea of how these ships work from movies and touring exhibits. My favorite was always the replica of the HMS Bounty that was constructed in 1960 for the 1962 movie Mutiny on the Bounty, featuring Marlon Brando, Trevor Howard, and Richard Harris. (The possibly more famous Clark Gable version was from 1935.) I visited the replica many times as a child when it was moored at the St. Petersburg Municpal Pier in Florida and later when it visited Annapolis, Maryland shortly before her unfortunate demise off the Outer Banks in Hurricane Sandy.


Loss of the HMS Bounty replica in 2012

The Bounty replica seemed downright spacious compared to the Elizabeth II. I’d always read about how small Christopher Columbus’ ships were and how small the Mayflower was but I’d never been on replicas that were that size. I’ve seen the USS Constitution in Boston and the USS Constellation in Baltimore, both of which are quite large. The ships I’ve seen in media and in person all had steering wheels. I recently learned the the Bounty replica, while very accurate in its reconstruction, was made twice as large as the original to accommodate the film crews and equipment. It’s easy to call up an image of an intrepid seaman lashing himself to the wheel in a raging storm, high on the raised, rear deck, holding forth against wind and rain and wave. (Never mind that the Bounty had only a single deck…)


The Elizabeth II, happily afloat!

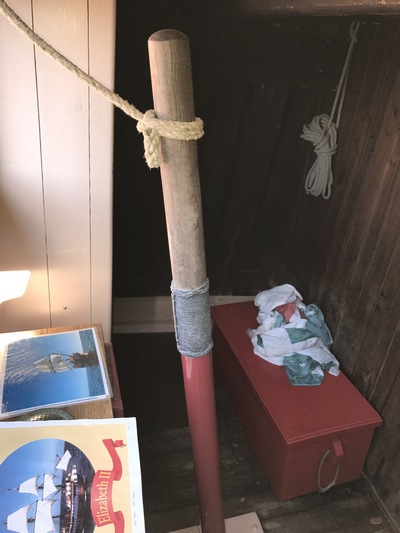
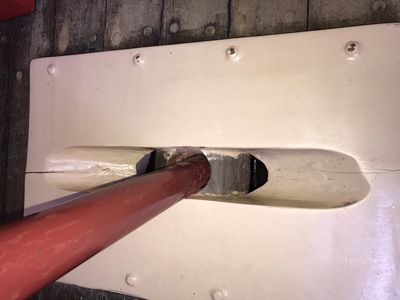
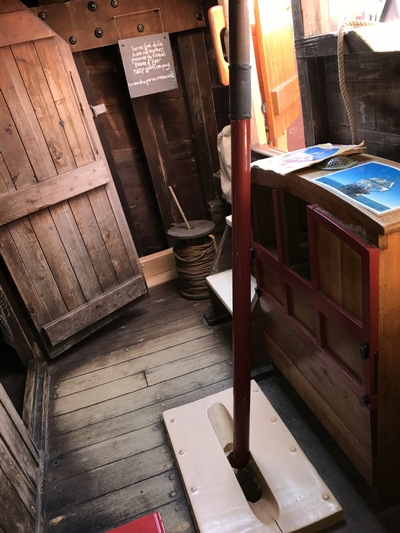
The problem was, when I went looking for said wheel on the Elizabeth II, I didn’t find one. There was a raised rear deck, alright, but there wasn’t a wheel up there. It was then that I noticed the large lever set into the floor in a compartment just below the raised, rear deck. I asked the costumed docent about this and was told that the lever used to steer the ship was called a whipstaff and that using wheels to control rudders was a later invention. Well I’ll be dipped in peanut butter and rolled in Corn Flakes! I hadn’t known that and I found it fascinating. It also makes perfect sense. Ship designers would use the simplest possible designs that would work until the vessels got big enough to require more oomph.


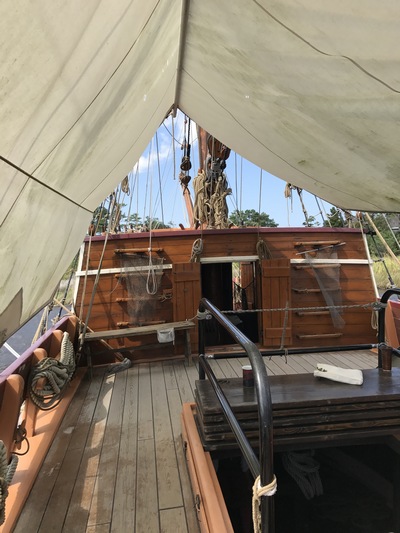
Looking toward the bow


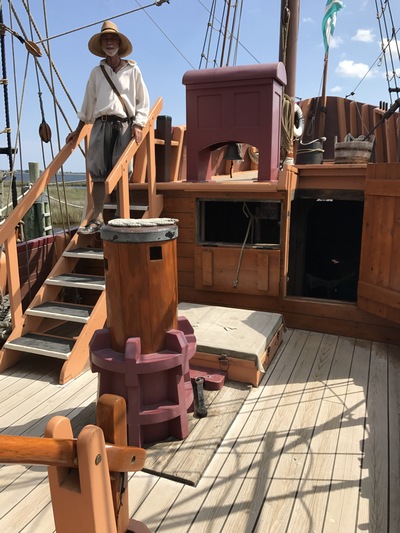
Looking toward the stern. Where’s that wheel? Oh… you can see the whipstaff though the opening down below.


Close-up view


Pivot mounting on the deck


View from the opposite side

Like the steam locomotives of a later age, sailing ships were the most complex engineered objects of their time. They were living, breathing entities with stories and “souls” all their own. The energy, investment, study, and thought that went into building and improving them rivals anything going on in high tech now. They were the Internet of their day, and made the world smaller in much the same way.

Posted in Life | Tagged , , | Leave a comment

Added CBAP Certification Today

Today I sat for and passed the Certified Business Analysis Professional (CBAP) exam issued by the International Institute of Business Analysis (IIBA). I sought this certification simply to communicate my experience throughout my career. I now list this credential as the first item in the list of my certifications. I found it easy to prepare for and found the test as annoyingly convoluted as the PMP exam.

The credential requires 7,500 hours of documented business analysis experience over the previous ten years (I could have listed a lot more, plus even more over the prior eighteen years), recommendations from two references (provided by the owners of the last two companies I worked for), and 35 contact hours of formal study with an approved provider (I took part in an online, interactive seminar series provided by Adaptive US), as well as the exam. The seminar provided by Adaptive was fairly well done and required a decent amount of interaction from the students, including needing to give short presentations on the subjects we were studying. I was able to leverage my experiences and resources on my website to demonstrate my experience very clearly.

Adaptive’s customer service was flat-out amazing. I’ve never encountered a company that does all the little things they do with such speed. Examples include paying your membership fees to IIBA and your exam fees, providing feedback, and forwarding information.

Adaptive’s training materials include a number of online question banks. I went through about 300 questions and reviewed the answers after each session. I skimmed through the BABOK Guide (v3) to get a feel for the structure of the material. I spent a few hours putting together a matrix of techniques used in the different knowledge areas as well as my own version of the outline grid. I noticed that Adaptive’s materials could used a bit of editing and cleaning up but, even more interestingly, I think I may have found an inconsistency in how one of the Guidelines and Tools is labeled in different knowledge areas (Requirements Management Tools / Repository in the Requirements Life Cycle knowledge area vs. Requirements Life Cycle Management Tools in the Requirements Analysis and Design Definition knowledge area). I plan to write to the IIBA to ask if this needs to be clarified.

Here is the two-sheet Excel file I made up to organize my thoughts. (Ignore the scratchwork to the right side of the first sheet.) I’m not sure the end result was useful per se, but the process of creating it got me used to the structure and vocabulary, which was probably helpful. I made up a similar study grid for the PMP exam in 2009, which is here. That actually proved to be more useful for me. I’ll update it some time after the new PMBOK Guide (Sixth Edition) is released in September.

I used this experience to extend my PMP certification out to 2021 and recently paid to have my Scrum certs extended to 2019. For my next trick I need to find out how to extend my Lean Six Sigma Black Belt certification beyond early 2018.

Posted in Tools and methods | Tagged , | Leave a comment

Methods of Observation

This past weekend my CBAP training course asked me to speak briefly on the technique of Observation. I reviewed the basic information in the BABoK itself and the training guide we’re using for the class, and I’ll refer to this page for a good recap of the context for applying this technique. What was more interesting to me, and what I didn’t have time to go into during my speaking time in the session, is a discussion of the many different methods of observations I’ve actually used.

I also have the idea that the BABoK should formally include the concepts of Discovery and Data Collection to its knowledge base, and probably also the concept of Domain Knowledge Acquisition. I will write on all of these subjects in the coming days.

  • Walk-throughs: These involve walking around and looking at the process to get an idea of where everything is and how it all fits together. Lean Six Sigma includes the idea of a waste walk which involves walking through an area where an operation is carried out and removing all materials which do not appear to be used in the operation. This clarifies and simplifies the environment and people’s understanding of the process. The general concept of “walking around” can be further subdivided as follows:
    • Guided: A guided walk-through is one where an expert in the process (executive, manager, or SME) walks you through a process and explains what’s going on in greater or lesser details. The guide may also introduce various process SMEs that the analysis team can interact with. The first time I experienced this was at an insurance company where we were analyzing a disability underwriting process in 1993. One of the executives walked us through the various departments and had SMEs explain their processes and operations to us. We did mostly discovery, mapping, and a rough order of magnitude of timing and effort involved in all the steps because the first phase of the project only involved a business case analysis. Our work (our consultancy built document imaging systems using FileNet) yielded an analysis and proposal that won our company the right to do the system implementation later on. I also participated in large numbers of tours through airports and land border points of entry (POEs) for reasons of both explanation and security.
    • Unguided: I’ve walked through many, many other processes without guidance to get my bearings when first arriving on site. This often happened in steel mills but also happened at smaller land POEs where we could easily figure out what was going on. In those cases we got most of our explanations from our hosts in the office or central area. When I worked in the paper industry I often walked around on my own while following the P&IDs (Process and Instrumentation Drawings, which often included heat and material balance information).

  • Drawings: I described following drawings (often printed on C-sized or D-sized sheets) but there were other situations, particularly in nuclear power plants, where the drawings were the only way to see what’s happening in the process. Not only are there security issues in nuclear plants but some areas are explicitly radioactive (albeit at a very low level under normal circumstances). We got information about elevations, piping and equipment sizing, room locations, and connection to other systems all without ever seeing any of it first hand (although I did visit a control room at the WNP2 plant in Richland, WA to record the steady state readings and settings on all of the control room indicators, recorders, and controls). We got many CAD drawings of floor plans of buildings for which we built evacuation simulations and more for to-scale layouts of land border POEs.
  • Internet research: I’ve gathered all kinds of information by searching the Internet. Much of that research was conducted to assess the state of the art of agent-based evacuation models (this included reviewing a number of papers from sources like IEEE and ACM) but I’ve also done such research to gauge the capabilities of competitive products and services. In many cases I’ve also used Google Earth to obtain to-scale overhead views of airports, border crossings, toll plazas, and other sites.
  • Electronic Data Collection: This is an automated form of gathering data that proceeds without human intervention.
    • Real-time: This type of data collection takes place “on the fly” as events occur.
      • Electronic / Instrumented: Computer systems of all kinds perform actions in response to various events. Any event that occurs can be captured for use by an internal or external process. The start, end, change of state, or problem associated with any event or process can be captured. This is true for systems that include physical sensors and processes and those that don’t. The industrial control systems I wrote for steel reheat furnaces recorded a wide variety of data. In more than one case we recorded system values for a third-party company that had an agreement with the customer that they would only be paid a percentage of money they helped the plant save in energy after they identified and implemented changes to their operations. We made files available for that company at intervals that recorded information about charge and discharge events, furnace temperatures, and fuel usage. Many of the analytic simulations I’ve written and worked with recorded key events for later statistical, ad hoc, and troubleshooting analysis.
      • Physical Sensors: Sensors that detect physical events but that are not integrated into the computer or control system under observation can also be used to collect data. For example, a proximity sensor might be used to detect, timestamp, and count object passing by a certain point over time, even while this information is not incorporated into the physical or integrated control system.
    • Historical: Historical data is anything recorded by or in a system that contains information about past events. Not all of the events described above will be stored or logged on a permanent or semi-permanent basis. The furnace control systems I wrote stored information about the events and operating parameters of the furnace as well as a detailed thermal history or each workpiece processed by the furnace. This information could be used in failure and quality analyses down the line. My team used decades of historical flight, maintenance, and supply data from Navy and Marine Corps databases to guide our operations research efforts. Interestingly, the data must be conditioned and cleansed beforehand because personnel on the ground (rightly, in most cases) are trained to prioritize getting the flight to go over recording the data correctly.
  • Visual / In-Person: This type of observation occurs as a result of direct human action.
    • Note-taking: Qualitative and quantitative observations can be recorded as notes. I have captured notes in writing, on tablets (on my iPad using a general app), and using a voice recorder for later transcription. Note that I never recorded anyone but myself. If I made recordings as part of an SME interview I did so while pausing to repeat or summarize what the SME had told me. I took several hundred such notes when collecting data on inspections as seven airports around the U.S. I later shared these with the industrial engineers who worked for the customer, who thought the information was extremely helpful. Of all the data collectors on all the teams we sent out, I was the only one who collected such notes.
    • Logsheets: These are pre-formatted forms that are filled out by observers watching a process in real time. The format of the forms specifies what data is collected.
    • Checklists: This is a less formal version of a logsheet.
    • Mobile Apps: Logsheets can be automated to be run on mobile devices. I’ve used custom data collection apps that run on Palm and Android devices. Lines on a checksheet tend to be implemented as full screens on handheld devices, but many formats are possible.
  • Interviews: Interviews are usually conducted in person but can also be done over the phone, Skype/Google Hangouts/etc., or correspondence, including by e-mail, all of which I’ve done. Interviews can be conducted as part of a walk-through or as separate activities. As noted above, I tend to record voice notes during interviews, where I repeat or summarize what I’ve been told by the SME, for written transcription later. If possible, I cycle a write-up of my findings back to the SME and other parties for review, comment, and verification.
  • Surveys: Surveys can be considered a form of observation, although, like Document Analysis, the BABoK may treat it as a separate technique.
  • Video: In situations where there’s too much going on to record events in person, or when the collection period is too long, video may be recorded for breakdown after the fact. I and my colleagues used this method to record inspection activities at land border crossings, airports, and other facilities. Another advantage of using this method is that a small number of people can travel to a site while a larger number of people can do the video breakdown (using checksheets, spreadsheets, or similar tool) back at the main office without incurring travel expenses. Videos can also be stored for later review. One company I worked for retained well over 1000 4-hour camcorder mini-cartridges.
  • Photographs / Pictures: I’ve taken plenty of pictures of sites for layout, context, and a jog to my memory.
  • Equipment Manuals and Specifications: This type of documentation can provide incredible amounts of information to an observer. I used such materials extensively when building simulations for nuclear power plants and paper mills. This method is applicable to any type of equipment.
  • Document Review and Capture: This is chiefly concerned with documents that are being handled as part of a larger process. They can be reviewed both for the specific information they contain and for the format of that information, which can guide the identification of requirements and data items.
  • Calculations: Calculations may have to be performed to infer values that cannot be measured directly. I’ve performed calculations to supplement observations in many different situations, but this primarily came up when analyzing processes for which I was building continuous simulations (those defined by differential equations).
  • Research: Research involves a combination of all of these methods.
  • Documented Procedures and Policies: There are cases where processes are never observed directly but rather discovered through review of published procedures and policies. The NAMP (Naval Aviation Maintenance Program) describes all of the activities and parameters involved in maintaining and flying aircraft.
  • Focus: Observations can be made to learn two classes of information:
    • for procedures/steps (qualitative): Discovery is about learning the layout, organization, and activities of a process.
    • for parameters/data (quantitative): Data Collection is about determining the operating parameters of the process.
Posted in Tools and methods | Tagged , , , , | Leave a comment