
Yesterday I gave my newly prepared talk on business analysis at the Pittsburgh IIBA Chapter Meetup, the first of three times I’m scheduled to give it. The presentation, prepared using the Reveal.js framework, is at the link:
http://rpchurchill.com/presentations/SimFrameForBA/
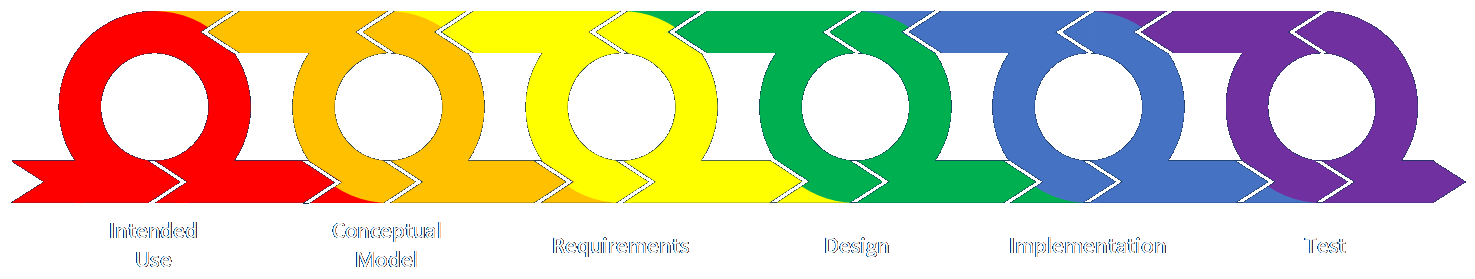
I’m sure the snow limited the turnout but it was still fun to do, and good practice. The talk covers the latest update to my analysis framework I’ve described previously here and here. I’ve changed the terminology to refer to the process steps rather than the documents produced during each step. The current listing is:
Project Planning
Intended Use (Identify or Receive Business Needs)
Assumptions, Capabilities, and Risks and Impacts
Conceptual Model (As-Is State)
Data Sources
–Requirements (To-Be State: Abstract)
–Functional (What it Does)
Non-Functional (What it Is, plus Maintenance and Governance)
Design (To-Be State: Detailed)
Implementation
Test
–Operation and Usability (Verification)
–Outputs (Validation)
Acceptance (Accreditation)
Project Closeout
I tried to get the audience a bit involved, beyond the normal interactions and questions during the talk, by asking the audience to fill out a brief survey before I started. It asked four things, in one-to-three-word answers:
- List 5-8 steps you take during a typical project.
- List some steps you took on a weird or non-standard project.
- Name three software tools you use most.
- Name three non-software techniques you use most.
I asked a few audience members to read off their steps in answer to the first question. When I heard their answers I realized I had slightly mis-worded the question, because many of them described the steps of a project and not an analysis. There is admittedly an overlap, but since this is a talk about business or process analysis I was trying to get them to talk about that. I will therefore change the wording of the first survey item to: “List 5-8 steps you take during a typical analysis effort.” I’ll reword the second item in the same way, as well. As I think about it I’m also going to add: “List the goals of some efforts for which you performed analysis.”
I’ll report the findings from later talks when they happen, but here are the responses from the sheets I was able to collect:
List 5-8 steps you take during a typical project.
- Requirements Gathering
- Initiation
- Testing
- QA
- Feedback
- User acceptance
- Requirement Elicitation
- UX Design
- Software Design for Testability
- Identify Business Goal
- ID Stakeholders
- Make sure necessary resources are available
- Create Project Schedule
- Conduct regular status meetings
- Meet with requester to learn needs/wants
- List details/wants/needs
- Rough draft of Project/proposed solutions
- Check in with requester on rough draft
- Make edits/adjustments | test
- Regularly schedule touch-point meeting
- Requirement analysis/design | functional/non-functional
- Determine stakeholders | user acceptance
- List the stakeholders
- Read through all documents available
- Create list of questions
- Meet regularly with the stakeholders
- Meet with developers
- Develop scenarios
- Ensure stakeholders ensersy requirements
- other notes
- SMART PM milestones
- know players
- feedback
- analysis steps
- no standard
List some steps you took on a weird or non-standard project.
- Made timeline promises to customers without stakeholder buy-in/signoff
- Regular status reports to CEO
- Adjustments in project resources
- Travel to affiliate sites to understand their processes
- Developers and I create requirements as desired
- Write requirements for what had been developed
Name three software tools you use most.
- Excel (3)
- Notepad (2)
- SQL Server (2)
- Visual Studio (MC)
- NUnit
- Team Foundation Server
- OneNote
- Word
- MS Office
- ARC / Knowledge Center(?) (Clint Internal Tests)
- Enbevu(?) (Mainframe)
Name three non-software techniques you use most.
- Elicitation
- Communication
- Documentation
- Recognize what are objects (nouns) and actions (verbs)
- Responsibility x Collaboration using index cards
- Scrum Ceremonies
- 1-on-1 meetings to elicit requirements
- Spreadsheets
- Meetings
- Notes
- Process Modeling
- Fishbone Diagram
- Lists
The point of the survey was to illustrate that different analysts use the same basic techniques but don’t always apply them in the same order or the same way. It therefore makes sense that the BABOK’s concepts are organized and presented in a rather general way. This became clear to me as I was preparing materials for this talk. The BABOK material was really easy for me to learn because I’d essentially seen it all before. It wasn’t until I tried to map its content, in terms of its six major knowledge areas, to the steps of my framework. You can see this in the slide titled “BABOK Knowledge Areas vs. Bob’s Framework.” It roughly goes from upper left to lower right, so that’s good, but the devil is in the details.
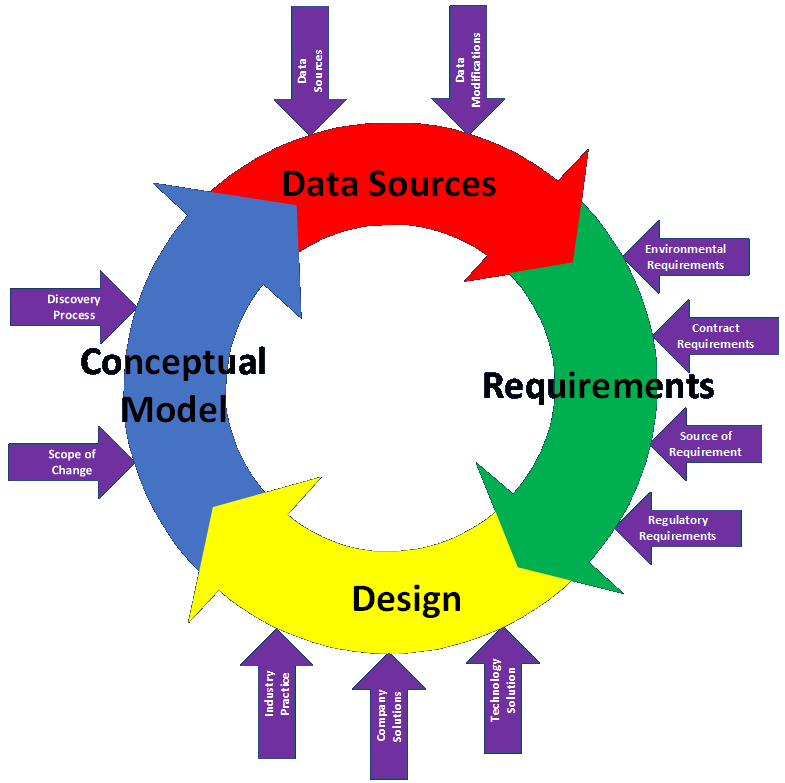
The biggest confusion is in the middle steps, Conceptual Model, Data Sources, Requirements, and Design, though I also differentiate between primary mappings (with bold, capital X’s) and secondary mappings (with grayed, lower-case x’s). The problem further extends into the Implementation step, which involves elements from all six BABOK knowledge areas to a greater or lesser degree. I ended up creating a slide that illustrated the complexity of the Concept-to-Design cycle to illustrate this, and this is not intended to convey the same idea as the later slide that shows how every step should be reviewed with the customer until agreement or acceptance and that newly identified elements may require the creation of a new source element in the previous step.
Clarification: Conceptual Model through Design
Customer Feedback Cycle
The steps I’ve developed grew out of my specific experience doing simulations of many different kinds. I’m going to write supporting blog posts for many of the slides and adding links to them from the slides and the accompanying PDF file of them. Look for them in the coming weeks.
In the meantime I’m really looking forward to gathering more data during future talks and reporting on it here. Stay tuned!