
How The Fifty Business Analysis Techniques Apply to the Solution Effort and the Engagement Effort
Yesterday I kicked off this discussion by clarifying the difference between the solution effort and the engagement effort. Again, the solution effort involves the work to analyze, identify, and implement the solution. Note that the solution should include not just the delivered operational capability but also the means of operating and governing it going forward. The engagement effort involves the meta-work needed to manage the process of working through the different phases. An engagement can be a project of fixed scope or duration or it can be an ongoing program (consisting of serial or parallel projects) or maintenance effort (like fixing bugs using a Kanban methodology). It’s a subtle difference, as I described, but the discussion that follows should make the difference more clear.
I want to do so by describing how the fifty techniques business analysis techniques defined in the BABOK (chapter ten in the third edition) relate to the solution and engagement efforts. I want to make it clear that as a mechanical and software engineer, I’m used to doing the analysis to identify the needs, do the discovery, collect the data, and define the requirements; manage the process from beginning to end; and then doing the implementation, test, and acceptance. A lot of BAs don’t have the experience of doing the actual implementations. To me it’s all part of the same process.
The definitions for each business analysis technique are taken verbatim from the BABOK. The descriptions of the uses to which they can be put within the context of my analytical framework are my own. I also refer to different kinds of model components as I described here.
-
Acceptance and Evaluation Criteria: Acceptance criteria are used to define the requirements, outcomes, or conditions that must be met in order for a solution to be considered acceptable to key stakeholders. Evaluation criteria are the measures used to assess a set of requirements in order to choose between multiple solutions.
An acceptance criterion could be the the maximum processing time of an item going through a process. An evaluation criteria might be that the item must exit a process within 22 minutes at least 85 percent of the time. Similarly, the processing cost per item might need to be less than US $8.50. These criteria can apply to individual stations or a system as a whole (e.g., a document scanning operation could be represented by a single station while a group insurance underwriting evaluation process would be made up of a whole system of stations, queues, entries, and exits).
Identifying the acceptance criteria is part of the solution effort. Knowing this has to be done is part of the engagement effort. Note that this will be the case for a lot of the techniques.
-
Backlog Management: The backlog is used to record, track, and prioritize remaining work items.
The term backlog is usually used in a Scrum context today, but the idea of lists of To-Do items, either as contract requirements or deficiency punch lists, has been around approximately forever. I’d bet my left arm they had written punch lists when they were building the pyramids in Egypt.
Managing the backlog is primarily part of the engagement effort. Doing the work of the individual backlog items is part of the solution effort.
-
Balanced Scorecard: The balanced scorecard is used to manage performance in any business model, organizational structure, or business process.
This is a technique only a consultant could love. In my opinion it’s just a made up piece of marketing twaddle. Like so many other techniques, it’s just a formalized way of making sure you do what you should be doing anyway.
OK, taking off my cranky and cynical hat I’ll say that techniques like these exist because somebody found them useful. While it’s clear that managers and practitioners should be evaluating and improving their capabilities from the point of view of customers, internal processes, learning and growth (internal and external), and financial performance, it never hurts to be reminded to do so explicitly. And heck, my own framework isn’t much more than an organized reminder to make sure you do everything you need to do in an organized way.
I would place this activity primarily in the context of the engagement effort, since it strikes me as a meta-evaluation of an organization that defines the context that determine the kind of solutions that might be needed.
-
Benchmarking and Market Analysis: Benchmarking and market analysis are conducted to improve organizational operations, increase customer satisfaction, and increase value to stakeholders.
This technique is about comparing the performance of your individual stations or activities and overall system (composed of collections of individual stations, queues, entries, and exits) to those of other providers in the market, by criteria you identify.
This seems to lean more in the direction of an engagement effort, with the details of changes made based on the findings being part of solution efforts.
-
Brainstorming: Brainstorming is an excellent way to foster creative thinking about a problem. The aim of brainstorming is to produce numerous new ideas, and to derive from them themes for further analysis.
This technique involves getting (generally) a group of people together to think about a process to see what options exist for adding, subtracting, rearranging, or modifying its components to improve the value it provides. This can be done when improving an existing product or process or when creating a new one from scratch.
A “process” in this context could be an internal organizational operation, something a product is or does, or something customers might need to improve their lives. It’s a very general and flexible concept.
Brainstorming is mostly about the solution effort, though engagement issues can sometimes be addressed in this way.
-
Business Capability Analysis: Business capability analysis provides a framework for scoping and planning by generating a shared understanding of outcomes, identifying alignment with strategy, and providing a scope and prioritization filter.
Processes made up of stations, queues, entries, and exits represent the capabilities an organization has. They can be analyzed singly and in combination to improve the value an organization can provide.
The write-up in the BABOK approaches this activity a bit differently and in an interesting way. It’s worth a read. That said, looking at things the way I propose, in combination with the other ideas described in this write-up, will provide the same results.
Since this technique is about the organization and its technical capabilities, it might be considered a mix of engagement and solution work, but overall it tends toward the engagement side of things.
-
Business Cases: A business case provides a justification for a course of action based on the benefits to be realized by using the proposed solution, as compared to the cost, effort, and other considerations to acquire and live with that solution.
A business case is an evaluation of the costs and benefits of doing things a different way, or of doing a new thing or not doing it at all. Business cases are evaluated in terms of financial performance, capability, and risk.
Business cases can be a mix of engagement and solution effort.
-
Business Model Canvas: A business model canvas describes how an enterprise creates, delivers, and captures value for and from its customers. It is comprised of nine building blocks that describe how an organization intends to deliver value: Key Partnerships, Key Activities, Key Resources, Value Proposition, Customer Relationships, Channels, Customer Segments, Cost Structure, and Revenue Streams.
Again, this is a fairly specific format for doing the kinds of analyses we’re discussing over and over again. It is performed at the level of an organization on the one hand, but has to be described at the level of individual processes and capabilities on the other. Once you’re describing individual processes and capabilities, you’re talking about operations in terms of process maps and components, where the maps include the participants, information flows, financial flows, resource flows, and everything else.
This technique also applies to both engagement and solution efforts.
-
Business Rules Analysis: Business rules analysis is used to identify, express, validate, refine, and organize the rules that shape day-to-day business behavior and guide operational business decision making.
Business rules are incorporated in stations and process maps in the form or decision criteria. Physical or informational items are not allowed to move forward in a process until specified criteria are met. Business rules can be applied singly or in combination in whatever way works for the organization and the process. If mechanisms for applying business rules can be standardized and automated, then so much the better.
Business rules are almost always created and evaluated at the level of the solution.
-
Collaborative Games: Collaborative games encourage participants in an elicitation activity to collaborate in building a joint understanding of a problem or a solution.
This has never been one of my go-to techniques, but I admire the people who can think up things that are applicable to a given real-world problem. I’ve seen these used pretty much exclusively as teaching and team-building exercises, and it’s difficult to imagine how this activity could be mapped directly onto a process map or its components.
That said, there are ways to gamify almost anything, even if it’s just awarding points for doing certain things with prizes awarded at intervals to individuals and teams who rack up the most. When I was in the Army a colleague came up with a way to have us remember a sequence of actions a weapon system crew had to call out to track and fire a missile, reinforced by calling out items as we passed a volleyball among ourselves.
If anything this technique belongs more in the realm of engagement efforts.
-
Concept Modeling: A concept model is used to organize the business vocabulary needed to consistently and thoroughly communicate the knowledge of a domain.
This is an integral part of domain knowledge acquisition, which I consider to be a core function of business analysts.
The description in the BABOK talks mostly about defining the relevant nouns and verbs in a domain, free of “data or implementation biases,” which is good advice based on my experience. The nouns and verbs of a process or domain should be identified (and understood) during the discovery phase of an engagement and then, only when that is done, the data should be captured during an explicit data collection phase. It’s possible to do both things at once, but only if you have a very clear understanding of what you’re doing.
This detailed work is almost always performed in the context of solution efforts.
-
Data Dictionary: A data dictionary is used to standardize a definition of a data element and enable a common interpretation of data elements.
This technique goes hand in hand with the concept modeling technique described directly above. Instead of describing domain concepts, though, it is intended to catalog detailed descriptions of data items and usages. Where domain nouns and verbs identify things (including ideas) and actions, data items are intended to characterize those things and actions. For example, a domain concept would be an isolated inspection process, which is a verb. The location or facility at which the inspection is performed would be a noun. The time it takes to perform the inspection is a datum (or collection of data, if a distribution of times is to be used in place of a single, fixed value) that characterizes the verb, while the number of items that can be inspected simultaneously is a datum (or collection of data is, say, that number changes throughout the day according to a schedule or in response to demand) that characterizes the noun.
The general type of data (e.g., continuous vs. discrete, integer vs. real, logical vs. numeric vs. enumerated type) may also be recorded in the dictionary. Specific information may also be recorded based on how the data is used in terms of the implementation. These may include numeric ranges (minimums and maximums), valid enumerated values (e.g., colors, months, descriptive types or classes of items or events), and detailed storage types (short and long integers, floating point variables of different lengths, string lengths, data structures descriptions, and so on).
A data dictionary is definitely associated with the solution effort.
-
Data Flow Diagrams: Data flow diagrams show where data comes from, which activities process the data, and if the output results are stored or utilized by another activity or external entity.
Data flow diagrams can be process maps of their own or can be embedded in process maps that also show the movement and processing of physical entities. Different representations might be used to make it clear which is which if both physical and informational entities are described in the same map, to improve clarity and understanding.
This technique is used in the context of the solution effort.
-
Data Mining: Data mining is used to improve decision making by finding useful patterns and insights from data.
People typically think of “Big Data” or “AI” or “machine learning” when they talk of data mining, but the concept applies to data sets of any size. Intelligent perusal and analysis of data can yield a lot of insights, even if performed manually by a skilled practitioner.
Graphical methods are very useful in this regard. Patterns sometime leap right out of different kinds of plots and graphs. The trick is to be creative in how those plots are designed and laid out, and also to have a strong understanding of the workings and interrelationships of a system and what the data mean. The BABOK mentions descriptive, diagnostic, and predictive methods, which can all use different analytical sub-techniques.
Although this technique can be used in support of the engagement effort if it’s complex enough, this kind of detailed, high-volume methodology is almost always applied to the solution.
-
Data Modeling: A data model describes the entities, classes or data objects relevant to a domain, the attributes that are used to describe them, and the relationships among them to provide a common set of semantics for analysis and implementation.
I see this as having a lot of overlap with the data dictionary, described above. It aims to describe data conceptually (as I describe in the Conceptual Model phase of my analytic framework), logically (in terms of normalization, integrity, authority, an so on), and physically (as instantiated or represented in working system implementations).
This technique is definitely used in solution efforts.
-
Decision Analysis: Decision analysis formally assesses a problem and possible decisions in order to determine the value of alternate outcomes under conditions of uncertainty.
The key point here is uncertainty. Deterministic decisions made on the basis known values and rules are far easier to analyze and implement. Those can be captured as business rules as described above in a comparatively straightforward manner.
Uncertainly may arise when aspects of the problem are not clearly defined or understood and when there is disagreement among the stakeholders. The write-up in the BABOK is worth reviewing, if you have the chance. There is obviously a wealth of additional material to be found elsewhere on this subject.
Interestingly, this kind of uncertainty is largely distinguished from the type of uncertainty that arises from the systemic variability stemming from concatenations of individually variable events, as found in processes described by Monte Carlo models. That kind of uncertainty is manageable within certain bounds and the risks are identifiable.
This technique is always part of work on the solution.
-
Decision Modeling: Decision modeling shows how repeatable business decisions are made.
This technique contrasts to Decision Analysis in that it is generally concerned with decisions that are made with greater certainty, where the factors and governing values are well understood, and where the implementations of the required calculations is straightforward. Note that the processes and calculations can be of any complexity, the differentiation is about the level of certainty or decidability.
This technique is also always part of the solution effort.
-
Document Analysis: Document analysis is used to elicit business analysis information, including contextual understanding and requirements, by examining available materials that describe either the business environment or existing organizational assets.
Document analysis can aid in domain knowledge acquisition, discovery, and data collection as described and linked previously. Documents can help identify the elements and behaviors of a system (its nouns and verbs), the characteristics of a system (adjectives and adverbs modifying the nouns and verbs), and the entities processed by the system. It the entities to be processed by the system are themselves documents, then they drive the data that the system must process, transport, and act upon.
In all cases this work is performed during the solution effort.
-
Estimation: Estimation is used by business analysts and other stakeholders to forecast the cost and effort involved in pursuing a course of action.
Estimation is a mix of science and art, and probably a black art at that. Any aspect of a process or engagement can be estimated, and the nature and accuracy of the estimate will be based on prior experience, entrepreneurial judgment, gathered information, and gut feel.
The BABOK describes a number of sub-techniques for performing estimations. They are top-down, bottom-up, parametric estimation, rough order of magnitude (ROM), Delphi, and PERT. Other methods exist but these cover the majority of those actually used.
As described in the BABOK this technique is intended to be used as part of the engagement effort.
-
Financial Analysis: Financial analysis is used to understand the financial aspects of an investment, a solution, or a solution approach.
Fixed and operating costs must be balanced against revenue generated for every process or group of processes. Costs may be calculated by working bottom-up from individual components and entities while revenues come from completed (through the sale) work items. The time value of money is often considered in such analyses; I took a course on this as a freshman in engineering school. I’m glad I gained this understanding so early. Risk is often calculated in terms of money, as well, and it should be remembered that uncertainty is always a form of risk.
I’ve always enjoyed analyzing systems from a financial point of view, because it provides the most honest insight into what factors need to be optimized. For example, you can make something faster at the expense of taking longer to make it, requiring more expensive materials, making it more expensive to build and maintain, and making it more difficult to understand. You can optimize along any axis beyond the point at which it makes sense. Systems can be optimized along many different axes but the ultimate optimization is generally financial. This helps you figure out the best way of making trade-offs between speed, resource usage, time, and quality, or among the Iron Triangle concepts of time, cost, and quality (or features).
Detailed cost data is sometimes hidden from some analysts, for a number of reasons. A customer or department might not want other employees or consultants knowing how much individual workers get paid. That’s a good reason in a lot of cases. Companies hiding or blinding data from outside consultants for reasons of competitive secrecy are also reasonable. A bad reason is when departments within an organization refuse to share data in order to protect their “rice bowls.” In some case you’ll build the capability of doing financial calculations into a system and test it with dummy data, and then release it to organizations authorized to work with live data in a secure way.
This is always an interesting area to me because four generations of my family have worked in finance in one capacity or another. As an engineer and process analyst I’m actually kind of a black sheep!
Financial analysis is a key part of both the solution and engagement efforts.
-
Focus Groups: A focus group is a means to elicit ideas and opinions about a specific product, service, or opportunity in an interactive group environment. The participants, guided by a moderator, share their impressions, preferences, and needs.
Focus groups can be used to generate ideas or evaluate reactions to certain ideas, products, opportunities, and risks. In terms of mapped processes the group can think about individual components, the overall effect of the process or system, or the state of an entity — especially if it’s a person and even more so if it’s a customer (see this article on service design) — as it moves through a process or system.
This technique is primarily used in solution efforts.
-
Functional Decomposition: Functional decomposition helps manage complexity and reduce uncertainty by breaking down processes, systems, functional areas, or deliverables into their simpler constituent parts and allowing each part to be analyzed independently.
Representing a system as a process map is a really obvious form of functional decomposition, is it not? A few more things might be said, though.
I like to start by breaking a process down into the smallest bits possible. From there I do two things.
One is that I figure out whether I need all the detail I’ve identified, and if I find that I don’t I know I can aggregate activities at a higher level of abstraction or moit them entirely if appropriate. For example, a primary inspection at a land border crossing can involve a wide range of possible sub-activities, and some of those might get analyzed in more detailed studies. From the point of view of modeling the facility, however, only the time taken to perform the combined activities may be important.
The other thing I do is group similar activities and see if there are commonalities I can identify that will allow me to represent them with a single modeling or analytical component or technique. It might even make sense to represent a wide variety of similar activities with a standard component that can be flexibly configured. This is part of the basis for object-oriented design.
A more general benefit of functional decomposition is simply breaking complex operations down until they are manageable, understandable, quantifiable, and controllable. The discussion in the BABOK covers a myriad of ways that things can be broken down and analyzed. The section is definitely worth a read and there are, of course, many more materials available on the subject.
Functional decomposition is absolutely part of the solution effort.
-
Glossary: A glossary defines key terms relevant to a business domain.
Compiling a glossary of terms is often a helpful aid to communication. It ensures that all parties are using an agreed-upon terminology. It helps subject matter experts know that the analysts serving them have sufficient understanding of their work. Note that this goes in both directions. SMEs are assured that the analysts serving them are getting it right, but the analysts are (or should be) bringing their own skills and knowledge to the working partnership, so their terms of art may also be added to the glossary so the SMEs being served understand how the analysts are doing it.
The glossary is chiefly part of the solution effort.
-
Interface Analysis: Interface analysis is used to identify where, what, why, when, how, and for whom information is exchanged between solution components or across solution boundaries.
This is a particular area of interest for me, so I’m going to break it down across all the concepts described in the BABOK.
- User interfaces, including human users directly interacting with the solution within the organization: Users and user interfaces can be represented as stations or process blocks in any system. They can be represented as processes, inputs, outputs, and possibly even queues in a process map. In other cases they can be represented as entities which move through and are processed by the system. (Alternatively, they can be described as being served by the system or process.) The data items transmitted between these components and entities are themselves entities that move through and are potentially transformed by the system.
- People external to the solution such as stakeholders or regulators: Information or physical materials exchanged with external actors (like customers) are typically represented as entities, while the actors themselves can be represented as entities or fixed process components.
- Business processes: Process maps can represent activities at any level of aggregation and abstraction. A high-level business operation might be represented by a limited number of fixed components (stations, queues, entries, and exits) while each component (especially stations) could be broken down into its own process map (with its own station, queue, entry, and exit blocks). An example of this would be the routing of documents and groups of documents (we can call those files or folders) through an insurance underwriting process, where the high-level process map shows how things flow through various departments and where the detailed process maps for each department show how individual work items are routed to an processed by the many individuals in that department.
- Data interfaces between systems: The word “system” here can refer to any of the other items on this list. In general a system can be defined as any logical grouping of functionality. In a nuclear power plant simulator, for example, the different CPU cores, shared memory system, hard disks, control panels and controls and displays and indicators mounted on them, thermo-hydraulic and electrical system model subroutines, standardized equipment handler subroutines, hard disks, tape backup systems, and instructor control panels are all examples of different systems that have to communicate with each other. As a thermo-hydraulic modeler, a lot of the interface work I did involved negotiating and implementing interfaces between my fluid models and those written by other engineers. Each full-scope simulator would include on the order of fifty different fluid systems along with a handful of electrical and equipment systems. Similarly, the furnace control systems I wrote had to communicate with several external systems that ran on other types of computers with different operating systems and controlled other machines in the production line. Data interfaces had to be negotiated and implemented between all of them, too. The same is true of the Node.js microservices that provided the back-end functionality accessed by users through web browsers and Android and iOS apps.
- Application Programming Interfaces (APIs): APIs can be prepackaged collections of code in the form of libraries or frameworks, while microservices provide similarly centralized functionality. The point is that the interfaces are published so programs interacting with them can do so in known ways without having to worry (in theory) about the details what’s going on in the background.
- Hardware devices: Communication with hardware devices isn’t much different than the communications described above. In fact, the interfaces described above often involve hardware communications. (See a brief rundown of the 7-layer OSI model here.)
I’ve written a lot about inter-process communication in this series of blog posts.
Data interfaces can be thought of at an abstract level and at a concrete level. Business analysts will often identify the data items that need to be collected, communicated, processed, stored, and so on, while software engineers and database analysts will design and implement the systems that actually carry out the specified actions. Both levels are part of the solution effort.
-
Interviews: An interview is a systematic approach designed to elicit business analysis information from a person or group of people by talking to the interviewee(s), asking relevant questions, and documenting the responses. The interview can also be used for establishing relationships and building trust between business analysts and stakeholders in order to increase stakeholder involvement or build support for a proposed solution.
Interviews involve talking to people. In this context the discussions can be about anything related to a process as it is mapped, in terms of its functional and non-functional characteristics. The discussions can be about individual components or entities, subsets of items, or the behavior of a system in its entirety.
I’ve interviewed SMEs, executives, line workers, engineers, customers, and other stakeholders to learn what they do, what they need, and how their systems work. I’ve done this in many different industries in locations all over the world. The main thing I’ve learned is to be pleasant, patient, respectful, interested, and thorough. Being thorough also means writing down your findings for review by the interviewees, so they can confirm that you captured the information they provided correctly.
This work is definitely part of the solution effort.
-
Item Tracking: Item tracking is used to capture and assign responsibility for issues and stakeholder concerns that pose an impact to the solution.
In the context described by the BABOK, the items discussed aren’t directly about the mapped components and entities of a system of interest. They are instead about the work items that need to be accomplished in order to meet the needs of the customers and stakeholders being served by the analyst. In that sense we’re talking about tracking all the meta-activities that have to get done to create or improve a mapped process.
I really enjoy using a Requirements Traceability Matrix (RTM) to manage these meta-elements. If done the way I describe in my blog post (just linked, and here generally, and also throughout the BABOK), the work items and the mapped components and entities will all to accounted for and linked forward and backward through all phases of the engagement. Indeed, the entire purpose of my framework is to ensure the needs of the stakeholders are met by ensuring that all necessary components of a system or process are identified and instantiated or modified. This all has to happen in a way that provides the desired value.
In the context discussed in the BABOK, this technique is used as part of the engagement effort.
-
Lessons Learned: The purpose of the lessons learned process is to compile and document successes, opportunities for improvement, failures, and recommendations for improving the performance of future projects or project phases.
Like the item tracking technique described above, this is also kind of a meta-technique that deals with the engagement process and not the operational system under analysis. The point here is to review the team’s activities to capture what was done well and what could be done better in the future. This step is often overlooked by organizations and teams are created and disbanded without a lot of conscious review. It’s one of those things where you never have time to do it right but you always have time to do it over.
It’s supposed to be a formal part of the Scrum process on a sprint and project basis, but it really should be done periodically in every engagement, and especially at the end (if there is an identifiable end). Seriously, take the time do do this.
As stated, this technique is also used during the engagement process.
-
Metrics and KPIs: Metrics and key performance indicators measure the performance of solutions, solution components, and other matters of interest to stakeholders.
These are quantifiable measures of the performance of individual components, groups of components, and systems or processes as a whole. They’re also used to gauge the meta-progress of work being performed through an engagement.
The BABOK describes an indicator as a numerical measure of something, while a metric is a comparison of an indicator to a desired value (or range of values). For example, an indicator is the number of widgets produced during a week, while a metric is whether or not that number is above a specific target, say, 15,000.
Care should be taken to ensure that the indicators chosen are readily collectible, can be determined at a reasonable cost, are clear, are agreed-upon, and and are reliable and believed.
Metrics and KPIs are identified as part of the solution effort. Note that the ongoing operation and governance of the solution by the customer, possibly after it has been delivered, is all part of the solution the BA and his or her colleagues should be thinking about.
-
Mind Mapping: Mind mapping is used to articulate and capture thoughts, ideas, and information.
I’ve never used an explicit mind-mapping tool, and I’ve only encountered one person who actively used one (as far as I know). That said, there are a lot of ways to accomplish similar ends without using an explicit software tool.
This technique actually has a lot in common with the part of the functional decomposition technique that involves organizing identified concepts into logical groups. Brainstorming with Post-It notes is a manual form of mind-mapping, and the whole process of discovery and domain knowledge acquisition (as I describe them) is supposed to inspire this activity.
For most of my life I’ve taken notes on unlined paper so I have the freedom to write and draw wherever I like to show relationships and conceptual groupings. Another way this happens is through being engaged with the material over time. I sometimes refer to this as wallowing in the material. Insights are gained and patterns emerge in the course of your normal work as long as you are mentally and emotionally present. These approaches might not work for everyone, but they’ve worked for me.
This technique is primarily applied as part of the solution effort.
-
Non-Functional Requirements Analysis: Non-functional requirements analysis examines the requirements for a solution that define how well the functional requirements must perform. It specifies criteria that can be used to judge the operation of a system rather than specific behaviors (which are referred to as the functional requirements).
These define what a solution is rather than what it does. The mapped components of a process or system (the stations, queues, entries, exits, and aths along with the entities processed), define the functional behavior of the process or system. The non-functional characteristics of a process or system describe the qualities it must have to provide the desired value for the customer.
Non-functional requirements are usually expressed in the form of -ilities. Examples are reliability, modularity, flexibility, robustness, maintainability, scalability, usability, and so on. Non-functional requirements can also describe how a system or process is to be maintained and governed.
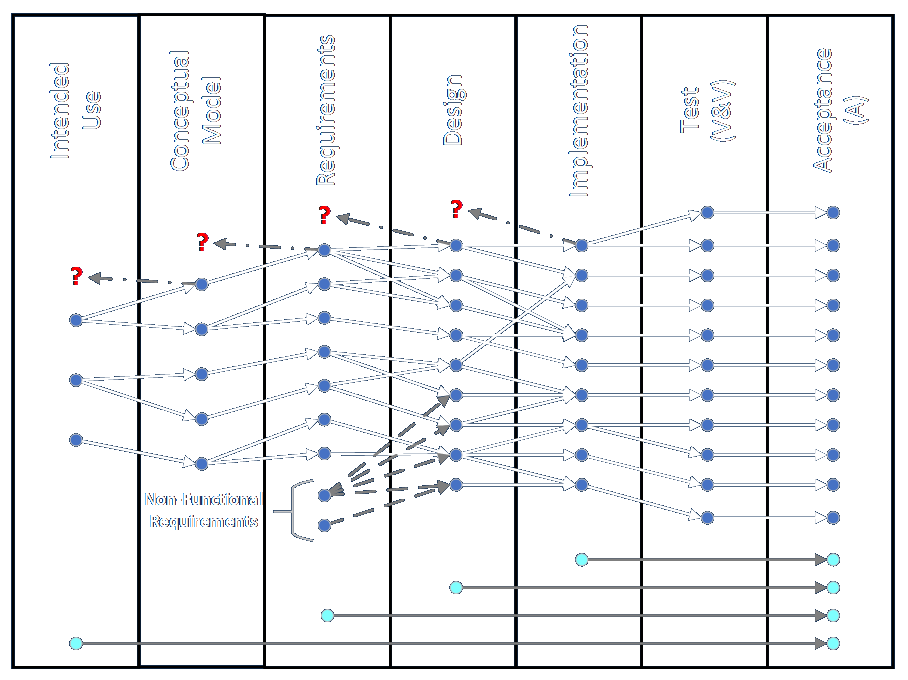
The figure at the bottom of this article graphically describes my concept of a requirements traceability matrix. Most of the lines connecting items in each phase are continuous from the Intended Use phase through to the Final Acceptance phase. These cover the functional behaviors of the system or process. The non-functional requirements, by contrast, are shown as beginning in the Requirements phase. I show them this way because the qualities the process or system needs to have are often a function of what it needs to do, and thus they may not be known until other things about the solution are known. That said, uptime and performance guarantees are often parts of contracts and identified project goals from the outset. When I was working the paper industry, for example, the reliability (see there? a non-functional requirement!) of the equipment was improving to the point that turnkey system suppliers were starting to guarantee 95% uptime where the previous standard had been 90%. I know that plant utilization levels in the nuclear industry have improved markedly over the years, as competing firms have continued to learn and improve.
I include a few other lines at the bottom of the figure to show that the engagement meta-process itself might be managed according to requirements of its own. However, I consider non-functional requirements analysis to be part of the solution effort.
-
Observation: Observation is used to elicit information by viewing and understanding activities and their context. It is used as a basis for identifying needs and opportunities, understanding a business process, setting performance standards, evaluating solution performance, or supporting training and development.
Observation is basically the process of watching something to see how it works. It can be used during discovery and data collection activities.
Observations are made as part of the solution effort.
-
Organizational Modeling: Organizational modeling is used to describe the roles, responsibilities, and reporting structures that exist within an organization and to align those structures with the organization’s goals.
Organizational models are often represented in the form of classic org charts. However, the different parts and functions within an organization can be mapped and modeled as stations (and other model components) or entities. Furthermore, entities are sometimes resources that are called from a service pool to a requesting process station to perform various actions. They may be called in varying numbers and for varying time spans based on the activities and defined business rules.
This activity is performed during the solution effort.
-
Prioritization: Prioritization provides a framework for business analysts to facilitate stakeholder decisions and to understand the relative importance of business analysis information.
This technique refers to prioritizing work items through time and different phases of an engagement. It does not refer to the order in which operations must be carried out by the system under analysis, according to business and other identified rules.
The BABOK describes four different approaches to prioritization. They are grouping, ranking, time boxing/budgeting, and negotiation. These are just specific approaches to doing a single, general thing.
Prioritization in this context is absolutely part of the engagement effort.
-
Process Analysis: Process analysis assesses a process for its efficiency and effectiveness, as well as its ability to identify opportunities for change.
In a sense this is the general term for everything business analysts do when looking at how things are supposed to get done. That is, everything having to do with the functional parts of a process involve process analysis. Examination of the non-functional aspects of an operation, what things are as opposed to what they do, is still undertaken in support of a process, somewhere.
In terms of a mapped process this technique involves identifying the components in or needed for a process, how to add or remove or modify components to change how it operates, how to move from a current state to a future state, and the impacts of proposed or real changes made.
Interestingly, simulation is considered to be a method of process analysis and not process modeling. This is because the model is considered to be the graphical representation itself, according to the BABOK, while simulation is a means of analyzing the process. I suppose this distinction might matter on one question on a certification exam, but in the end these methods all flow together.
Although the engagement effort is itself a process, this technique is intended to apply to the solution effort.
-
Process Modeling: Process modeling is a standardized graphical model used to show how work is carried out and is a foundation for process analysis.
Process models are essentially the graphical maps I’ve been describing all along, as they are composed of stations, queues, entries, exits, connections or paths, and entities. Information, physical objects, and activities of all kinds can be represented in a process map or model.
When they say a picture is worth a thousand words, this is the kind of thing they’re talking about. In my experience, nothing enhances understanding and agreement more than a visual process model.
The BABOK goes into some detail about the various methods that exist for creating process maps, but in my mind they’re more alike than different.
This technique is clearly to be applied as part of the solution effort.
-
Prototyping: Prototyping is used to elicit and validate stakeholder needs through an iterative process that creates a model or design of requirements. It is also used to optimize user experience, to evaluate design options, and as a basis for development of the final business solution.
A prototype is a temporary or provisional instantiation of part or all of a proposed solution. Prototypes are created so they can be understood and interacted with. The idea of a prototypes is extremely flexible. They can range from temporary models made with throwaway materials to working bits of software to full-scale, flyable aircraft.
A simulation of something can also serve as a prototype, especially simulations of systems with major physical components.
Prototyping is absolutely part of the solution effort.
-
Reviews: Reviews are used to evaluate the content of a work product.
Work products in my framework are created in every phase of an engagement, and thus reviews should be conducted during every phase of the engagement. This is done to ensure that all parties are in agreement and that all work items have been addressed before moving on to the next phase. The review in each phase is performed iteratively until the work for that phase is agreed to be complete. If items are found to have been missed in a phase, the participants return to the previous phase and iteratively complete work and review cycles until it is agreed that attention can be returned to the current or future phases.
Note that multiple items can be in different phases through any engagement. While each individual item is addressed through one of more phases, it is always possible for multiple work items to be in process in different phases simultaneously.
Reviews are meta-processes that are part of the engagement effort.
-
Risk Analysis and Management: Risk analysis and management identifies areas of uncertainty that could negatively affect value, analyzes and evaluates those uncertainties, and develops and manages ways of dealing with the risks.
The subject of risk can be addressed at the level of individual components in mapped systems, especially when provisions for failures are built into models, but they are more often handled at the level of the system or engagement. The BABOK gives a good overview of risk analysis and management and many other materials are available.
Risks are evaluated based on their likelihood of occurrence and their expected impact. There are a few straightforward techniques for calculating and tracking those, mostly involving risk registers and risk impact scales. The classic approaches to risk are generally categorized as avoid (take steps to prevent negative events from happening), transfer (share the risk with third parties, with the classic example being through insurance), mitigate (act to reduce the chances a negative event will occur or reduce the impact if it does occur), accept (deal with negative events as they occur and find workarounds), and increase (find ways to take advantage of new opportunities).
Risk has been an important part of two classes of simulation work I’ve done. The first involved dealing with adverse occurrences in nuclear power plants. A variety of system failures (e.g., leaks and equipment malfunctions) were built into the fluid, electrical, and hardware models in the operator training simulators we built. If such failures happened in a real plant (see Three Mile Island, where a better outcome would have resulted if the operators had just walked away and let the plant shut down on its own), especially since the likelihood of any particular adverse event was rare, there would be the possibility that the operators would not know how to diagnose the problem in real time and take the proper corrective action. Building full scope training simulators reduced the risk of operating actual plants by giving operators the experience of reacting to a wide variety of failures they could learn how to diagnose and mitigate in a safe environment. In terms of mapped processes, the failure mechanisms were built in to the model components themselves (stations, paths or connections, entries, and exits, and so on), and controlled by training supervisors.
The second way I worked with risk in the context of simulation was when I worked with Monte Carlo models. These involve running a simulation through multiple iterations where many of the outcomes are determined randomly. The combinations and permutations of how those many random events concatenate and interact can result in a wide variety of outcomes at the whole-system level. The purpose of these simulations was to learn how often negative system outcomes were going to occur (based on potentially thousands of possible failures that occurred at known rates), and work on ways to mitigate the effects of negative systemic outcomes.
Risks are managed at both the solution and the engagement level. It is one of the most important considerations for any analyst or manager.
-
Roles and Permissions Matrix: A roles and permissions matrix is used to ensure coverage of activities by denoting responsibility, to identify roles, to discover missing roles, and to communicate results of a planned change.
This technique is used to determine what which actors are empowered to take which actions. In terms of system maps the actors will be represented as process blocks or possibly resources able to interact with an trigger other system events.
In the context of the BABOK this analysis is part of the solution effort. It deals with how the customers will interact with the provided solution.
-
Root Cause Analysis: Root cause analysis is used to identify and evaluate the underlying causes of a problem.
Root cause analysis is always served by knowing more about the system being investigated. The more you know about the components and interactions of a system the easier it will be to determine the root cause of any outcome, whether desired or undesired.
Process or system maps greatly aid in the understanding of a system and its behavior and the behavior of its components. Fishbone diagrams and The Five Whys are important sub-techniques used in this kind of analysis.
This technique is used as part of the solution effort.
-
Scope Modeling: Scope models define the nature of one or more limits or boundaries and place elements inside or outside those boundaries.
Process or system maps make very clear what is within the scope and outside the scope of any system. Note that systems can be defined in many ways and that many subsystems can be aggregated to form a larger system. An example of this from my own experience is the creation of fifty or more separate fluid, electrical, and equipment handler models to construct a full scope operator training simulator.
Scope boundaries are usually determined by grouping components together in a logical way so their interactions and effects have their greatest effect in a specified range of space, time, function, and actors (people). The scope of different systems also defines responsibility for outcomes related to them.
An example of scope determined by space would be hydrological models where the flow of water is governed by the topology and composition of the landscape. An example of scope determined by time is the decision to include hardware and components that affect system behavior when a plant is operating to generate power, and not to include equipment like sample and cleanout ports that are only used when the plant is in a maintenance outage. An example of scope determined by function is the isolation of the logical components that filter reactor water to remove elements like boron and other particulates. An example of scope determined by actors is the assignment of permissions (or even requirements) to give approval for certain actions based on holding a certain credential, as in requiring sign-off by a civil engineer with a PE license or requiring a brain surgeon to have an M.D. and malpractice insurance.
Analyzing the system’s components is an aspect of the solution effort, while determining what components and responsibilities are in and out of scope might be part of the engagement effort, since this may involve negotiation of what work does and does not get done.
-
Sequence Diagrams: Sequence diagrams are used to model the logic of usage scenarios by showing the information passed between objects in the system through the execution of the scenario.
Sequence diagrams are a specific kind of process map that organizes events in time. The specific methods for creating them are defined in the UML standard (I bought this book back in the day). The diagrams don’t necessarily show why things happen, but they do give insight into when they happen and in what order. They also show the messages (or objects) that are passed between the different packages of functionality.
This detailed activity takes place in the context of the solution effort.
-
Stakeholder List, Map, or Personas: Stakeholder lists, maps, and personas assist the business analyst in analyzing stakeholders and their characteristics. This analysis is important in ensuring that the business analyst identifies all possible sources of requirements and that the stakeholder is fully understood so decisions made regarding stakeholder engagement, collaboration, and communication are the best choices for the stakeholder and for the success of the initiative.
Stakeholders are affected by work done to build or modify the process or system under investigation and by the work done through the phases of the engagement itself. They may be included as components or resources in process models. The degree to which they are affected by the current scope of work or are able to exert influence over the capabilities under analysis can be represented by onion diagrams or stakeholder matrices (of which the RACI Matrix is a classic example).
This technique is definitely part of the engagement effort.
-
State Modeling: State modeling is used to describe and analyze the different possible states of an entity within a system, how that entity changes from one state to another, and what can happen to the entity when it is in each state.
A state model describes the conditions or configurations an object or component can be in, the triggers or events that cause the state to change, and the allowable states that can be transitioned to from any other state. Diagrams can show these transitions independent of any other process map or timing diagram or the concepts can be embedded or otherwise combined. In terms of the elements I’ve defined, stations, paths or connections, entities, resources, and even entries and exits can all change state if it makes sense in a given context.
This work is always part of the solution effort.
-
Survey or Questionnaire: A survey or questionnaire is used to elicit business analysis information—including information about customers, products, work practices, and attitudes—from a group of people in a structured way and in a relatively short period of time.
The information gathered can relate to any aspect of work related to the solution or to the engagement.
-
SWOT Analysis: SWOT analysis is a simple yet effective tool used to evaluate an organization’s strengths, weaknesses, opportunities, and threats to both internal and external conditions.
These efforts are generally undertaken at the level of the behavior or capability of entire systems, though they can also be about technologies that can improve all or part of an existing system or even the work of one or more phases of an engagement.
This technique is therefore applicable to both the solution effort and the engagement effort.
-
Use Cases and Scenarios: Use cases and scenarios describe how a person or system interacts with the solution being modeled to achieve a goal.
These are used in the design, requirements, and implementation phases of an engagement, to describe user actions to achieve certain ends. The are many ways to describe the qualities and capabilities a solution needs to have, and use cases are only one.
While use cases are similar in many ways to user stories, they aren’t always exactly the same thing.
These techniques are applied to describe detailed aspects of the solution.
-
User Stories: A user story represents a small, concise statement of functionality or quality needed to deliver value to a specific stakeholder.
Like use cases, user stories are an effective means for capturing and communicating information about individual features of a solution. Note that use cases are not to be confused with formal requirements.
The technique is generally associated with the Agile paradigm in general and the Scrum methodology in particular. They are typically written in the following form, or something close to it: “As a user role, I would like to take some action so I can achieve some affect.”
While this is a useful technique, I have the (possibly mistaken) impression that it is relied upon and otherwise required far in excess of its actual usefulness. For example, I would disagree with anyone who asserts that every backlog item must be written in the form of a user story.
Like the use case technique from directly above, this technique is also applied as a detailed part of the solution effort.
-
Vendor Assessment: A vendor assessment assesses the ability of a vendor to meet commitments regarding the delivery and the consistent provision of a product or service.
Vendors may be evaluated for the ability to perform any work or deliver any value related to the solution or to the engagement.
-
Workshops: Workshops bring stakeholders together in order to collaborate on achieving a predefined goal.
These collaborations with groups of stakeholders can be used to gather information about or review any aspect of work on the solution effort or any phase of the engagement.
Here is a summary listing of the fifty BA techniques and the type of effort they most apply to.
| BA Technique | Effort Type |
|---|---|
| Backlog Management | Engagement |
| Balanced Scorecard | Engagement |
| Benchmarking and Market Analysis | Engagement |
| Brainstorming | Solution |
| Business Capability Analysis | Engagement |
| Business Cases | Both |
| Business Model Canvas | Both |
| Business Rules Analysis | Solution |
| Collaborative Games | Engagement |
| Concept Modelling | Solution |
| Data Dictionary | Solution |
| Data Flow Diagrams | Solution |
| Data Mining | Solution |
| Data Modelling | Solution |
| Decision Analysis | Solution |
| Decision Modelling | Solution |
| Document Analysis | Solution |
| Estimation | Engagement |
| Financial Analysis | Both |
| Focus Groups | Solution |
| Functional Decomposition | Solution |
| Glossary | Solution |
| Interface Analysis | Solution |
| Interviews | Solution |
| Item Tracking | Engagement |
| Lessons Learned | Engagement |
| Metrics and KPIs | Solution |
| Mind Mapping | Solution |
| Non-Functional Requirements Analysis | Solution |
| Observation | Solution |
| Organizational Modelling | Solution |
| Prioritization | Engagement |
| Process Analysis | Solution |
| Process Modelling | Solution |
| Prototyping | Solution |
| Reviews | Engagement |
| Risk Analysis and Management | Both |
| Roles and Permissions Matrix | Solution |
| Root Cause Analysis | Solution |
| Scope Modelling | Both |
| Sequence Diagrams | Solution |
| Stakeholder List, Map, or Personas | Engagement |
| State Modelling | Solution |
| Survey or Questionnaire | Both |
| SWOT Analysis | Both |
| Use Cases and Scenarios | Solution |
| User Stories | Solution |
| Vendor Assessment | Both |
| Workshops | Both |
Here are the counts for each type of effort:
| Effort Type | Number of Occurrences |
|---|---|
| Solution | 30 |
| Engagement | 11 |
| Both | 9 |