
On Monday I attended a Meetup at the IIBA’s Pittsburgh Chapter for a presentation about structured problem solving given by a gentleman named Greg Acton.
The presentation included an introduction of about twenty minutes, a small group exercise for another twenty minutes, and a follow-on group discussion for a further twenty minutes, all of which were highly engaging. Mr. Acton added another twenty minutes or so sharing an interesting story about how the analysis technique he described worked on a different problem at a well-known organization.
I enjoyed the entire affair because it lines up so closely with my own experiences and body of knowledge. To begin, Mr. Acton and I have a number of shared or parallel experiences. We both spent some early years in the military (he on Aegis Missile cruisers, I in Air Defense Artillery, where I worked with several different missile systems; I also supported several Navy programs over the years and was at one point offered a job building maintenance training simulations of Aegis cruisers, which for various reasons I declined). We both trained as Six Sigma Black Belts. He plied his Six Sigma training at Amazon in the early 2000s. I made it through several rounds of programming tests and phone interviews with Amazon in the late 90s, with a goal of programming large-scale optimizations of product distribution and warehouse pre-positioning involving 60,000 variables at a pop, before deciding that 70 hours a week working on Unix systems in Seattle was less appealing than other options I had at the time (which themselves sometimes involved huge commitments of time). Finally, we both attended Carnegie Mellon University (he in computer science followed by an MBA, I in mechanical engineering with a bunch of computing courses). One of the courses I enjoyed most during my time there was called Analysis, Synthesis, and Evaluation (ASE, it’s no longer offered under that name but the ideas remain in force all through the university’s verbiage), which was all about problem solving and creative thinking. One of the difficult things for me to assimilate at that time was the idea that many of the parameters of a problem could be estimated just by thinking about them. I was stuck on the concept of having to go look and measure things. Having looked at and measured countless things over the years I have come to appreciate the idea of getting an order-of-magnitude hack at a problem without a vast amount of moving around.
The example I’ll offer is one our course instructor gave, which was estimating how much water a pendulum-driven bilge pump might have to remove from a boat during the course of a day. Figuring one wave-driven pump cycle every few seconds and a volume of water measuring twenty feet by five feet by four inches (give or take in any direction), you might end up with 57,400 cubic inches of water. Hmmm. Given 86,400 seconds per day we might need a bilge pump to remove one the order of two cubic inches per cycle. That seems like a lot. If we assume ten feet by two feet by three inches we get something like a half a cubic inch per cycle. That could work for smaller boats and for less leakage. When the professor worked it out in class he suggested the amount of water moved per cycle was roughly equivalent to spitting one time. That seemed tractable for a simple, inexpensive, unpowered device for small boats.
One thing we didn’t get to do in that course, which I very much looked forward to, was participate in the bridge building exercise. To illustrate that engineers are essentially economists who do physics, the activity shows that engineering decisions are driven by a constrained optimization process. The goal is to build a bridge that spans a specified distance (about 24 or 30 inches) and holds a flat platform/roadway. Weights are then hung from the roadway. Points are scores for the amount of weight supported up to 35 pounds and for the inverse weight of the bridge. That is, the lighter the bridge, the more points scored. Structures were typically made out of combinations of balsa wood, fishing line, cardboard, and glue. I saw older classmates do this before my junior year but for whatever reason we didn’t do this. (I remain somewhat cranky that I feel like I spent four years doing random differential equations and never feeling like I was ever doing anything, but I guess that’s why I enjoyed my computing courses and hands-on projects I got to do with my fraternity during those years.) I heard that a similar contest in earlier years involved building a contraption to help an egg survive being dropped from the nearby Panther Hollow Bridge. (We jokingly referred to this as the Panther Hollow Drop Test and applied it to many items in a humorous vein.) Points in this context were awarded increasingly with decreasing weight and decreasing fall time. A parachute-based device would gain points for being light but lose points for falling slowly. A flexible, water-containing device would fall quickly but be heavy. You get the idea…
One of the techniques described in the ASE class was to brainstorm every possible variable that could have an effect on the operation of a system or process. We tended to list things in groups which were plotted at right angles (imagine a chessboard in two dimensions or a Rubik’s Cube in three) to define combinations of variables we’d have to consider, which brings us back to the presentation. We were asked to analyze why certain classes of Lyft drivers achieved slightly different outcomes. (I’m going to be deliberately vague about the details.) The specific method Mr. Acton described involved starting with one or more root factors and then branching off through more and more sub-factors, listing possible outcomes of each (in this case each factor could reasonably be divided into only two cases). In our group I suggested listing every possible factor that could affect a trip (or fare) and a driver’s willingness to volunteer for it. The speaker described a left-to-right breakdown of the problem (one to many) but allowed that a right-to-left approach could also be valid (start with many and organize). That turns out to be a common approach, and brainstorming is, of course, a standard BABOK technique. We knew about surge pricing, where prices increase to incentivize drivers to meet demand in more difficult situations, so we concentrated on listing factors which different drivers would approach differently. We didn’t get our list diagrammed out the way we were shown but we had a good conversation. And, obviously, one can only expect to get so far in twenty minutes.
Next came the open discussion, where each of the six groups described what they had come up with. It was interesting that more or less every group came up with at least some unique factors to consider in analyzing the problem. When Mr. Acton described the ultimate findings they made sense. The finding also noted that the system was “working as designed” and so there wasn’t necessarily a “problem.” The kinds of analyses each group was doing could ultimately have led them to the correct answer, though I can’t remember offhand if any of the groups had listed either of the two factors that ultimately drove the variation that inspired the analysis in the first place.
On the theory that if all you have is a hammer everything looks like a nail I was reminded all through the evening of a number of techniques I’ve used and how they could also be applied successfully.
The first was called Force Field Analysis, which I learned about from a Total Quality Management (TQM) consultant in the mid-90s. I don’t know if that could have solved the whole problem, but I was reminded of it during the small group session as we were thinking about how different factors affected different types of drivers.
As a simulationist I clearly spent a lot of time thinking both about how I might build a simulation of the Lyft ecosystem that could generate statistics that would illuminate the problem and how I would definitely do discovery and collect data for building it. The latter activity alone may well allow me (or anyone) to identify the factors that turned out to be decisive.
I was finally reminded of the idea of analyzing equations to see the effects of modifying every possible term. Back in the day I wrote a tool to calculate pressure drops through sections of piping systems of the type found in paper mills and nuclear power plants. I had to do a bit of digging in old code and documentation and a bit of web searching to recreate the crime 🙂 but the basic equation is shown below (click on it to go to the source page).
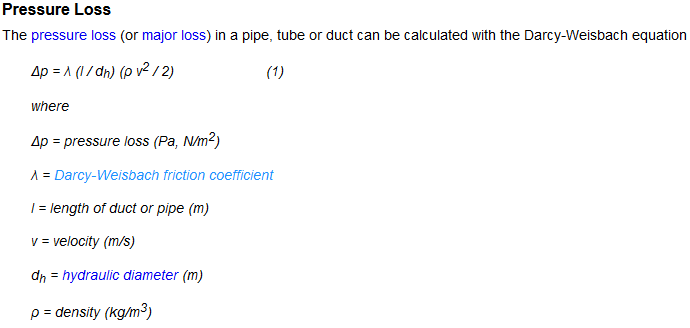
That’s not all there is to it, the Darcy-Weisbach friction coefficient (represented by the lambda character), itself needs to be calculated (and is in my code). One method for doing so is linked at the linked page. I’d give you what I had in my engineering notes from December of 1989 but that particular file is somewhere in storage. Anyway, the point is that you can see what happens if you change things. The length term is in the numerator so it’s clear that pressure drops will be larger in longer runs of pipe. The diameter of the pipe is in the denominator. This indicates that a larger (wider) pipe will incur a lower pressure drop. The density term is in the denominator, which means that you need to move more mass you need more pressure. The velocity term is in the denominator and is a squared function, which means that you would need four times the pressure to move the fluid at double the speed. The coefficient is not constant, and varies with factors like the roughness of the inside of the pipe (which itself may be a function of its age) and the viscosity of the fluid being pushed (molasses is more viscous than water or steam and thus requires more pressure to push).
This kind of analysis is great when the terms are well understood and verified through experiment and long practice. When you’re trying to write your own equations, however, you can run into trouble.
Consider the analysis of several factors on the price of a good in a market. The best economic analysts know you can’t write an accurate equation to describe this but as a thought experiment we can write something like:
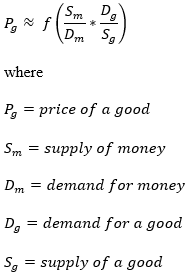
This isn’t a “real” equation in any sense but it can be a useful tool for understanding the factors that may affect prices. If the supply of money or demand for a good increase, those terms being in the numerator, the price of the good should, in theory, increase. If the demand for money or the supply of a good increase then the price of the good would tend to decrease. Like everything in economics it’s way more complicated but remember it’s a thought experiment, a tool.
There are a few other things we can do with this rough tool. We can look at all of the terms individually and see what factors affect the values of each. Many economic theorists assert that the supply of money should be defined in different ways. The Federal Reserve publishes a whole range of values for different formulations of the money supply. Other economists define even more values. When it comes to demand for money how does one even assign a numeric value to it? The same applies to the demand for a good. How do substitution effects figure in? What special situations occur? Do you measure the supply of a good by what’s available to consumers, what’s sitting in warehouses (or in DeBeers’ diamond safes being purposefully held off the market), or what’s planned in terms of production capacity or reserves in the ground?
Analysts often have trouble defining concepts like inflation, and many different formulations and definitions exist. As citizens and observers we feel in our gut that it’s a comparison between the supply and demand of money vs. the supply and demand of goods on a macro scale, and we might be able to consider the problem in terms of the above equation. The use of such an equation is problematic but again we can do some useful thought exercises. If the money supply goes down then we would usually expect that prices would go down (we’d call this negative inflation or deflation). So far, so good, right? But what if the demand for money goes down even more? This would (again, in theory) cause prices to rise. This would be counterintuitive to many economists and many other observers.
Looking at the problem from a different angle we could ask whether trying to come up with a single index value for inflation across an entire economy even has meaning. Consider the following graph of price changes in different sectors over a recent twenty year period.

If prices in different sectors are changing at such different rates then what does a single, aggregate index number mean? Are the sector indices even meaningful given that they are also based on a myriad of individual prices?
A really good monetary theorist would account for all of these terms but some prominent economists appear to omit terms, like the demand for money. How would that affect an analysis?
Returning to our work as system, process, or business analysts we see that we have to try very hard to ensure we identify every relevant factor. To do this we may have to identify every possible factor and explicitly determine whether it’s relevant. I like to invoke this cover photo from an interesting book to illustrate the point.

This image cleverly demonstrates why it’s important to look at problems from all angles. The many techniques listed in the BABOK represent a diffuse way to look at problems from many angles, while something like Unified Modeling Language (UML) is a more organized way.
Mr. Acton also referred to some prickly problems that involved large numbers of interrelated values, and he used the term cross-product to describe that interrelatedness. I don’t remember the exact details or context but it made me remember a series of mechanisms in a large scale maintenance logistics model I worked with for nearly five years while supporting Navy and Marine Corps aviation activities. A number of very smart people analyzed, pondered, modified, and argued over the model the entire time with a near-religious fervor (which I loved, by the way) and we ended up making some fairly substantive changes during the time I was there. One change was based on an understanding I came to of the context of how a complicated cross-product actually generated outcomes in the heart of the model. Again, I’m not sure we were thinking about the same things but we’re clearly both thinking of complex, interrelated systems and effects.
The speaker described a single technique but also explained that he works with an organization that employs and teaches a wide range of problem-solving techniques that are all geared toward the practice of peeling problems apart so they can be properly analyzed and effectively understood and improved. I imagine that the entire body of knowledge would be worthwhile to explore.