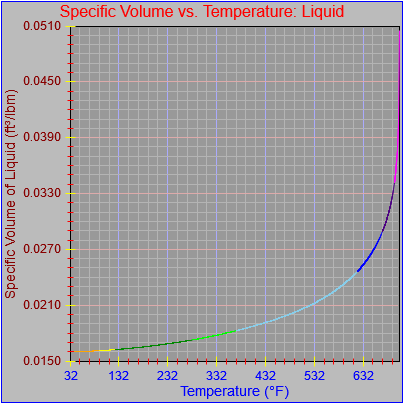
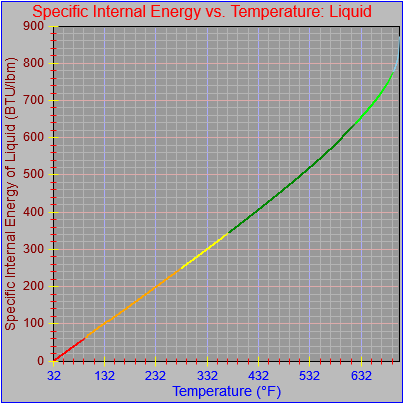
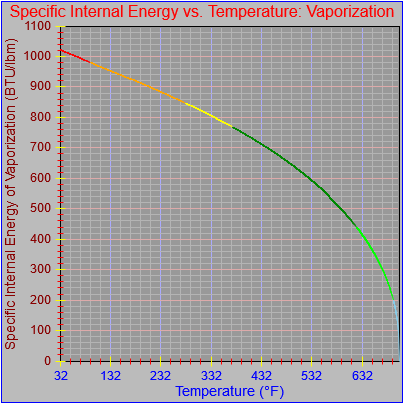
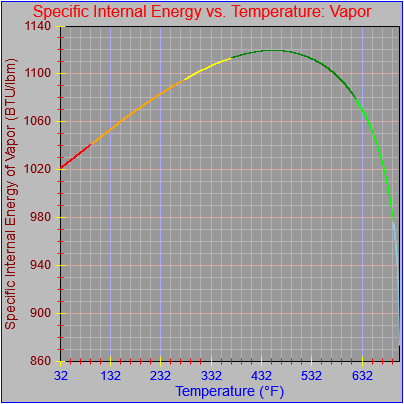
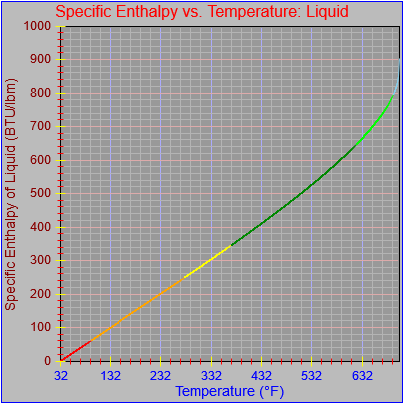
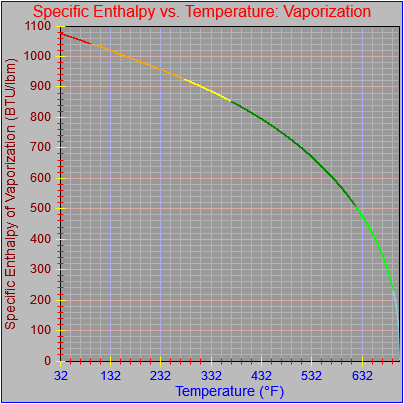
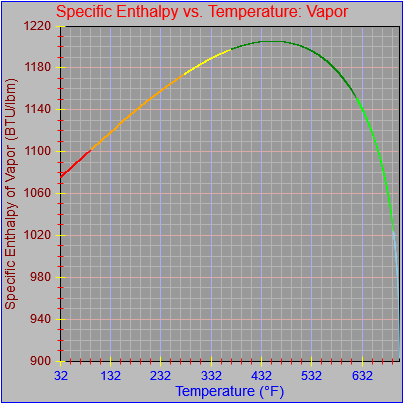
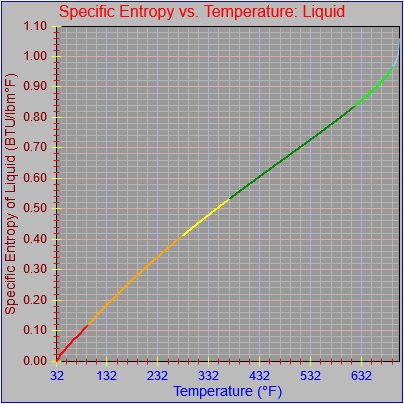
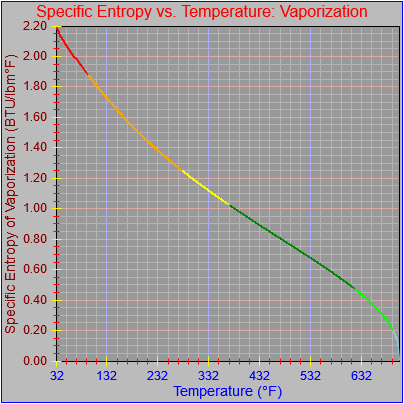
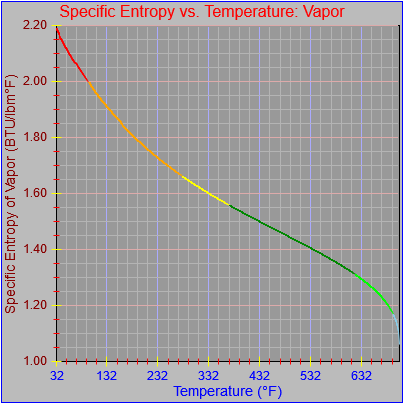
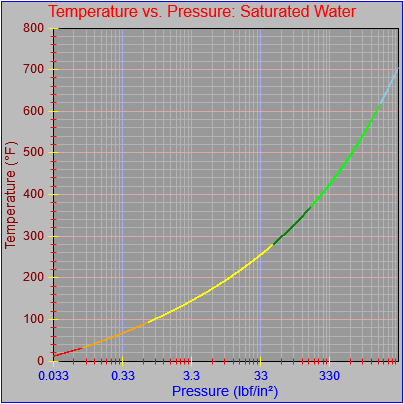
Today I extended all 24 functions to their full range, 0-705.44 °F and 0.08866-3203.6 psi. I’ve shown the functions vs. temperature; the functions vs. pressure are generally derived from the same lines in the steam tables so the only difference would be the values and units on the x-axis.
One problem that comes up is how to deal with endpoints or local extreme values. Continuous functions are written out pixel by pixel along the x-axis, so if the value chosen doesn’t happen to fall right on an endpoint or a local high or low value then part of the curve won’t be drawn. I’ve finessed this for today by defining the endpoints of the x-axis to coincide with the exact high and low values of the input range (i.e., the x-axis, with some tweaking by hand at the high end), which really isn’t satisfactory. I can think of a few things I might do but none make me very happy. I’m going to have to do some research and think about it a little more.
In the meantime, here are the full plots vs. temperature, and the plot of temperature vs. pressure as a representative example.