One of the problems with developing from a quick hack, as I have here, is that you sometimes have to take a step back and do some serious re-plumbing. In this case that means breaking things apart and defining axes as separate objects. That’s the way I actually did it the first time I executed this project. This has the benefit of allowing me to easily specify any number of axes and also cuts the amount of code and unique variable names almost in half from what I had. It took some doing over the weekend and this morning but I’m well on my way.
Not everything is quite as automated as it was but I’ll get back to that point over the next couple of days. In the meantime I’ve defined a plot area which is part of the graph object itself and each of the defined axes. I also defined a TextSizer object, one instance of which is defined as part of the graph object and references to which are passed to each axis object. That allows all entities to refer to the same instantiation. For now the TextSizer doesn’t do any more than the original custom sizing function(s) did, but a mechanism is in place that can be expanded and generalized as needed, so it can potentially handle a wider variety of fonts and pixel sizes. It may be a good idea to store reference to the plot area in the same way–or it might not. It’s the difference between storing four local coordinate values and going through the extra reference indirections to access the ones stored with the graph object (rather than the individual axes). My feeling is that saving the time for the extra reference indirections is worth giving up the extra storage for each axis object (even if they all contain the same information), but that’s just a gut feeling. I could go the other way if I decide that thee repetitive storage hurts my soul more than giving up a few clock cycles. Given the magnitude of the effects of the decision, which approaches zero, I think I’m going to stop thinking about it. I only report it because it may be worth describing how I subconsciously consider such issues at all times.
Finally, I added a few more complications to govern the display of the plotting area. I’ll go into some of the edge cases these brought up in the days ahead. They mainly have to do with the kind of lines that are drawn around the boundary of the plot area. It’s also clear that a designer would have to be careful not to specify that tick lines not be drawn across the plot area based on potentially incompatible locations from multiple axes in one direction (say, if two or more y-axes were specified with independent scales).
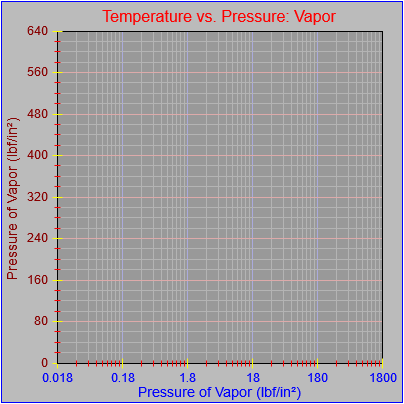
In the meantime, the figure below shows that I’m able to generate more or less the same display elements I could before, minus the actual function plot, so I know I haven’t lost anything. I left all the old code in place so one of the first things I’ll do going forward is comment out all the code and declarations that have been obviated, to ensure I don’t still have any hidden dependencies.