Up until not the graph object has required that the parameters governing the generation of axis tick labels be specified explicitly. However, it would be nice for the graph to be able to generate reasonable value labels on its own given the high and low range of data it’s supposed to plot. I decided that a) I wanted to make this happen and b) I’m not overly mad about the way I’ve seen it done by other software.
I have a few more scenarios to test (I haven’t looked at ranges that cross zero, i.e., that have both negative and positive values) but I did come up with a method that should generate roundish values across somewhere between six and eleven cycles.
I began with the observation that the size of the chosen interval should be based on the span of values (the difference between the highest and lowest values in a data set) and not by the magnitude of the values. Basically, I calculate the span, divide it by six, and then massage that value until it looks like a fairly rounded value of the appropriate magnitude. The code listing is shown farther down.
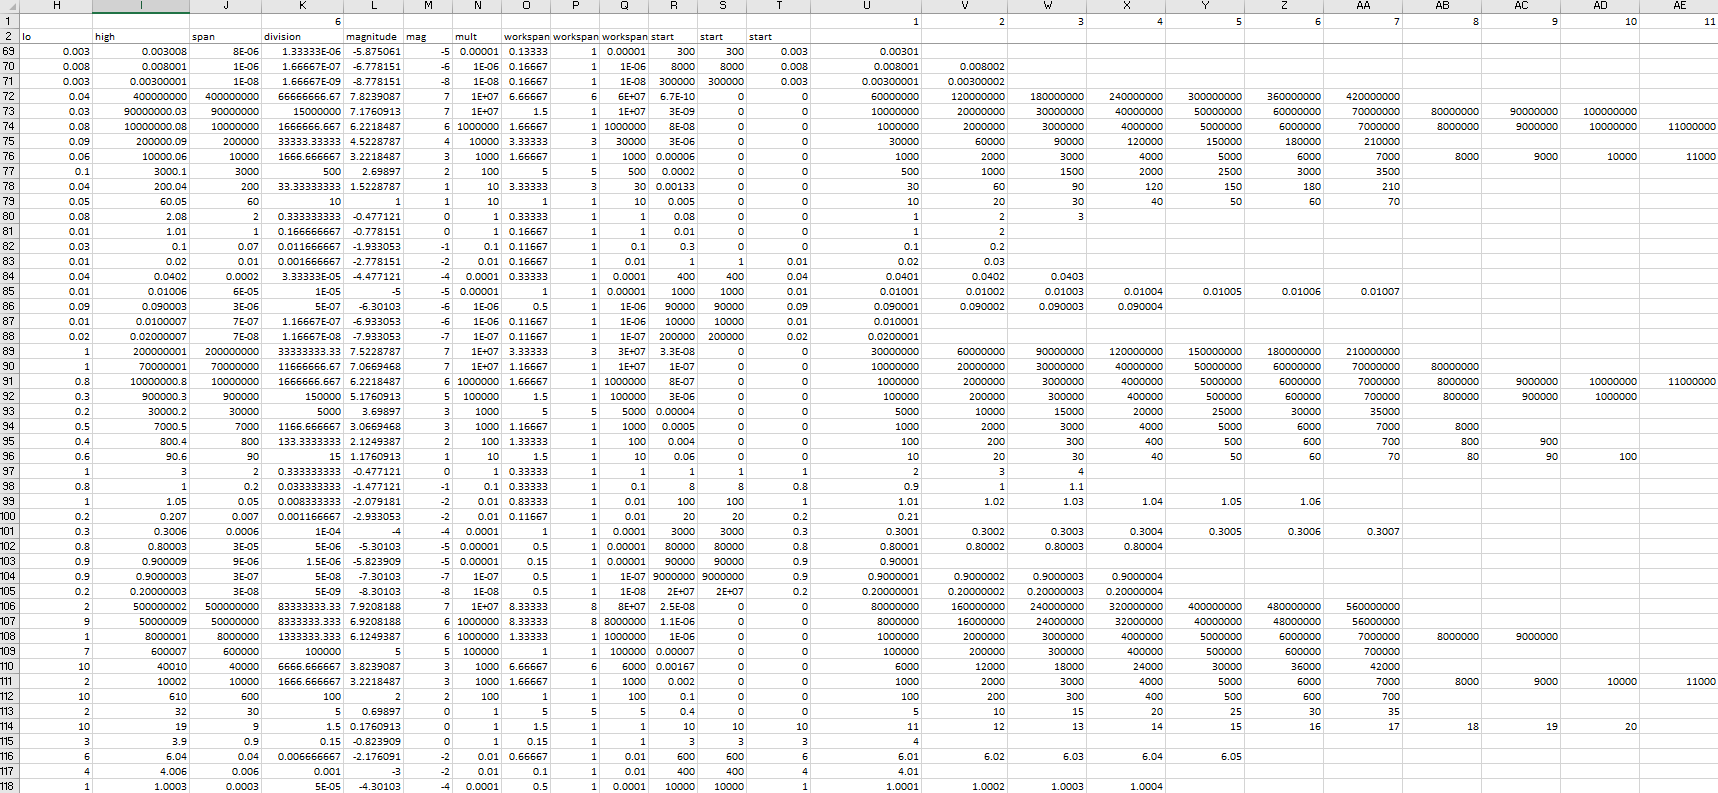
I wrote some code and tried a few range values but realized I needed to be more systematic and exhaustive, so I created an Excel worksheet that tested combinations of base values from 10-6 to 106 and ranges from 10-8 to 108, with some randomization thrown in for the first significant digit. It implemented the code in spreadsheet form and listed the expected results. You can see the patterns in the image, starting from column T and moving right.

As you can see, some combinations of base and range yield only two or three values for the range, while other combinations yield up to a dozen (and other testing has indicated that more may be possible). I therefore found it necessary to add extra checks to divide the interval if there are too few and shrink the interval if there are too many. That said, I also found that the code behaves just a little bit differently than does the spreadsheet (it gives better results, I think the problem in the spreadsheet is in columns K and L, which corresponds to lines 7 to 15 in the code snippet), but the adjustments are occasionally still needed.
So far I’ve just written the code to generate the range values but I have not yet extended this to draw the values generated. That’s going to be interesting because the calculations generate unexpected results when some of the values cannot be represented exactly. Who can tell what’s going to happen when you think you’re supposed to get 0.002999, 0.003009, and 0.000001 but you actually get 0.0029990000000000004, 0.0030080000000000016, and 0.0000010000000000000002? Another issue is that combinations of very large and very small numbers (e.g., 4,700,000,000.0000007) cannot be represented; the least significant digits get truncated entirely.
Annoyances like this came up when I wrote code to generate graphs in the early 90s and they come up now, but that’s part of the game, isn’t it? Computers do what they do and you have to work around that. The formatting routines for displaying the tick values may or may not take care of these issues so we’ll see how it goes. If they don’t, then I’m going to add some extra manipulations.
|
1 2 3 4 5 6 7 8 9 10 11 12 13 14 15 16 17 18 19 20 21 22 23 24 25 26 27 28 29 30 31 32 33 34 35 36 37 38 39 40 41 42 43 44 45 46 47 48 49 50 |
this.findAxisValuesAuto = function(ilo,ihi,axis) { var span = ihi - ilo; var division = span / 6.0; var magnitude = Math.log(division) / Math.log(10); var mag = Math.floor(magnitude); var mult = 1; if (mag > 0) { for (var i=0; i<mag; i++) { mult *= 10.0; } } else if (mag < 0) { for (var i=0; i>mag; i--) { mult /= 10.0; } } var workspan = division / mult; workspan = Math.floor(workspan); workspan *= mult; var start = ilo / workspan; start = Math.floor(start); start = start * workspan; var end = start; var count = 0; while (end <= ihi) { end += workspan; count++; } var reset = false; if ((count == 1) || (count == 2)) { workspan = workspan / 5.0; reset = true; } else if ((count == 3) || (count ==4)) { workspan = workspan / 2.0; reset = true; } else if (count > 11) { workspan = workspan * 2.0; reset = true; } if (reset) { start = ilo / workspan; start = Math.floor(start); start = start * workspan; end = start; count = 0; while (end < ihi) { end += workspan; count++; } } |
I’ll be testing this going forward and describe any further modifications I identify.
