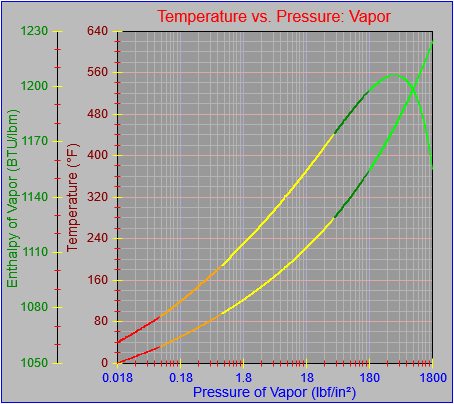
Now that the axis objects have been split out from the main graph object it’s a simple matter to add in as many as you need, as seen in the image. This example shows parallel axes stacked side to side, but it would be easy to imagine plots being stacked lengthwise, as is often seen in dual plots of stock price and trading volume by time period.
Note that the second axis in either direction would usually be drawn adjacent to the other side of the plot area, which would also require that the elements be drawn in the other direction from the base location of the axis. That will involve more parameters and code, which I believe will be tomorrow’s project.
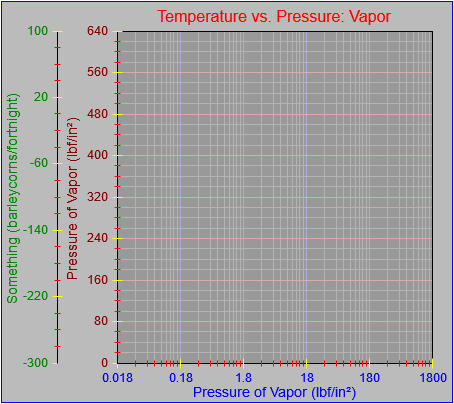
Also, every decision you make has unexpected consequences. For example, I initially assumed that the axes would always meet in the lower left corner of the graph and for some reason decided that tick marks in that corner should not be drawn over the axes in that corner. This looks OK when the axes do, in fact, meet in that corner, but not so good when they don’t. One case where that may happen is where an axis intersects a perpendicular axis at an arbitrary location and another is when an axis floats away from the plot area as shown here. In that case it just looks stupid.
Here are a few things that need to happen:
- Ticks specified to cross an axis should be drawn that way no matter where they fall.
- The spacing and buffers within and around each axis element have to be reconsidered.
- Once the axis elements are reworked the ability to click on the related area should be added, as a way to kick off user modification processes.
- The labels are drawn relative to the location of the axis, but the axis itself may need to be able to be drawn in a different spot, and the parameters needed to keep track of all that need to be added.
- The location of axis endpoints should be specified as it is currently.
- Tick labels should always be drawn close to that location.
- The axis label should be drawn just outside the tick labels.
- The axis itself should be drawn based on where it intersects an axis perpendicular to it, by value for that axis and not by pixel.
- It’s possible that ticks should be drawn close to the tick labels and on an axis display in the middle of a plot area. Maybe.
- Buffer spaces should be defined between all elements: inner tick to axis (if that axis is floating and not on or directly adjacent to the plot area), axis or tick to tick label, tick label to axis label, axis label to outer buffer. That should provide enough information to allow all axes to space themselves relative to the specified edge of the graph object, the plot area, and other axes in the same direction.
- If multiple axes are to be drawn, then certain limits may need to be placed on them:
- Floating axes should not be able to be longer than the one(s) adjacent to the plot area.
- If automatic sizing is to be attempted (I had it, but for the time being I’ve lost it), the end buffer space requirements of the axis that takes up the most pixels should govern the required end buffer space for all parallel axes.
- In theory, no more than one axis in either direction should be able to be drawn somewhere in the middle of the plot area, away from its labels.
- Similarly, only one axis in either direction should be able to generate background lines on the plot area, and that should probably be the first one listed, one directly adjacent to the plot area, and probably the primary axis on the left side or the bottom.
- It may be possible to stack axes along their length instead of side to side as shown. Consider a display that shows stock prices and ranges by day in a large, upper section and the volume traded by day in a smaller, lower section, as described above. On the other hand, it would be just as simple to do the same thing using two separate graphs, or some new type of object using polymorphism and inheritance.
- At some point, if things get too crazy, it may not be possible to automatically place all elements. Some user intervention may be needed.
I decided I’d keep working on things and updated the plotting functions for multiple axes. This involves passing not only the values through to the plotting routines but the relevant axes as well. Functions to determine the pixel location along each axis are called separately.
Of course, you now can’t tell which graph is associated with each axis, but that’s easy enough to address.