
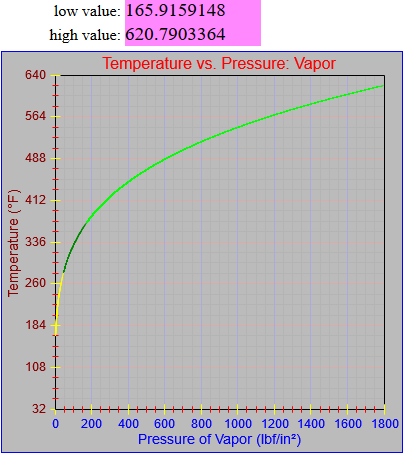
I started working through the graphs of the various thermodynamic functions vs. pressure and recognized that the standard format wasn’t showing all of the detail contained in the fits across the different ranges of input pressure. If the plotable width of the graph is about 350 pixels over a range of 1800 psi on a linear scale that would mean that every pixel represents a range of over 5 psi. As you can see from the function below the lower two ranges cover less than that and as a result would not even show up on a standard plot.
|
1 2 3 4 5 6 7 8 9 10 11 12 13 14 15 16 17 18 19 20 21 22 23 24 25 26 27 28 29 30 31 32 33 34 35 36 37 38 39 40 41 42 43 44 45 46 47 48 49 50 51 52 53 54 55 56 57 58 59 60 61 |
function PFind_T(P) { var temp = 0.0; if (P <= 0.0) { graphCycle = graphCycleBottom0; } else if (P < 0.0019) { graphCycle = 1; temp = (-40 + (0.0019 - P)*(-7142.857)); } else if (P < 0.08866) { graphCycle = 2; P = Math.log(P); P = P + 6.26590139280974E+0000 + 2; temp = -6.89351170861096E+0001; temp += ( 1.30050423829122E+0001 * P); temp += ( 7.31258080071309E-0001 * P * P); } else if (P <= 0.8) { graphCycle = 3; temp = 3.33934342833700E+0001 * P; temp += ( 2.17077559430164E-0001 / P); temp += (-2.49565709833529E+0001 * Math.sqrt(P)); temp += ( 2.81308744499854E+0001 * Math.log(P)); temp += (-1.25784522492054E+0001 * P * P); temp += ( 3.34979532697040E+0000 * P * P * P); temp += 1.02298078764073E+0002; } else if (P <= 50) { graphCycle = 4; temp = -2.99124380544527E-0001 * P; temp += ( 2.68463065388278E+0000 / P); temp += ( 1.32892779311514E+0001 * Math.sqrt(P)); temp += ( 2.94664325500198E+0001 * Math.log(P)); temp += ( 1.51666454163202E-0004 * P * P); temp += ( 2.28440791389534E-0006 * P * P * P); temp += -1.56749381553382E+0001; temp += 1.01699999999953E+0002; } else if (P <= 180) { graphCycle = 5; temp = 3.74987064978268E+0000 * P; temp += ( 2.16828072878346E+0003 / P); temp += (-1.02468079912476E+0002 * Math.sqrt(P)); temp += ( 2.99347435622010E+0002 * Math.log(P)); temp += (-3.92313778545628E-0003 * P * P); temp += ( 3.50250493113408E-0006 * P * P * P); temp += -6.67984428873286E+0002; temp += 2.81029999999795E+0002; } else if (P <= 1800) { graphCycle = 6; temp = -7.86998246486519E-0002 * P; temp += (-4.87149019710720E+0002 / P); temp += ( 9.75184636544145E+0000 * Math.sqrt(P)); temp += ( 2.73146506017656E+0001 * Math.log(P)); temp += ( 1.16067971316358E-0005 * P * P); temp += (-1.69705925255891E-0009 * P * P * P); temp += -2.56172361345496E+0002; temp += 3.73129999999888E+0002; } else { graphCycle = graphCycleTop0; temp = 0; } return temp; } |
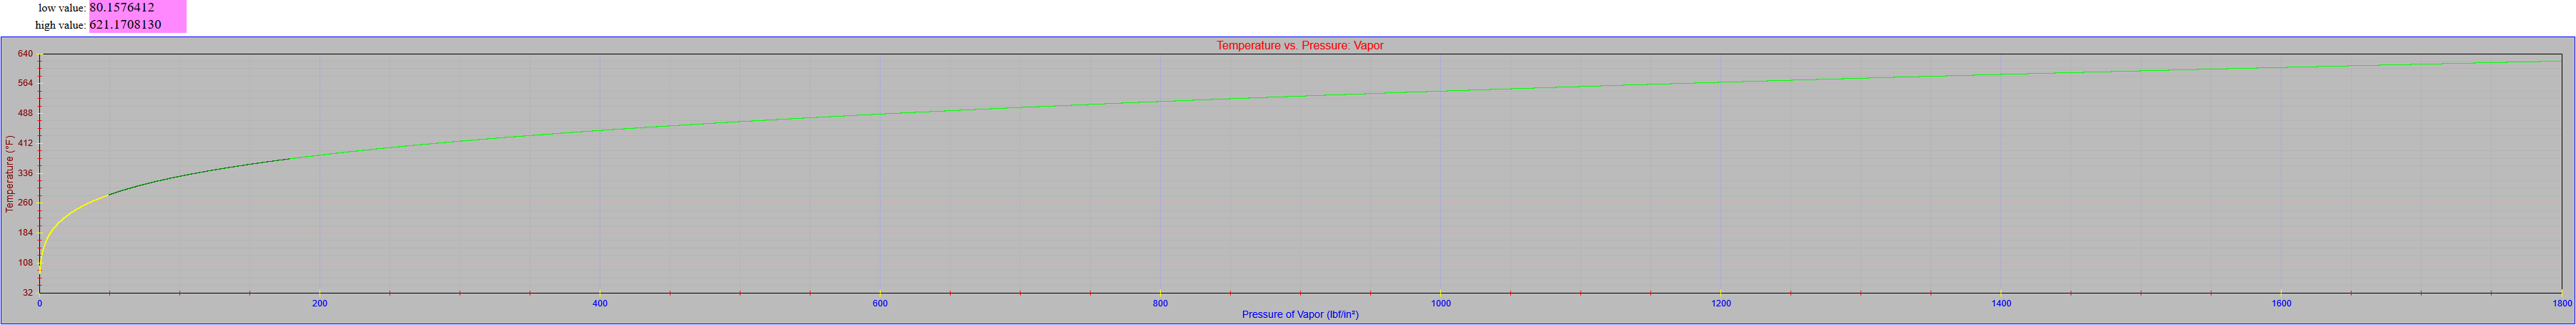
Expanding the plot to around 2000 pixels still doesn’t show all the details in a meaningful way. (The graph below is scrollable sideways.)
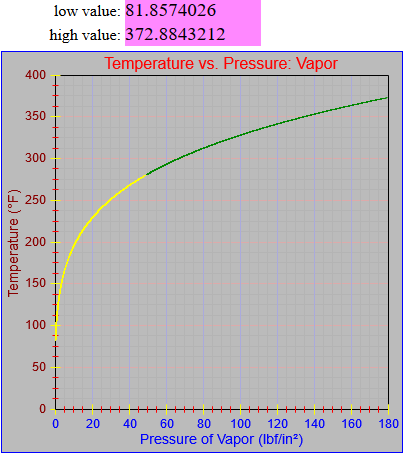
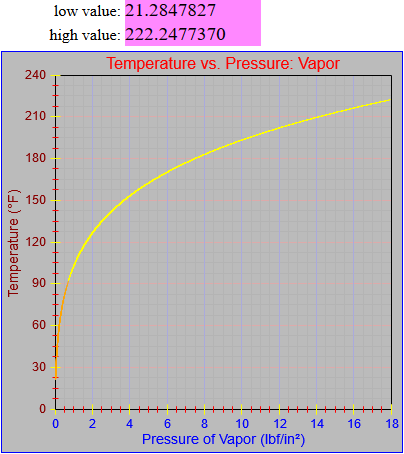
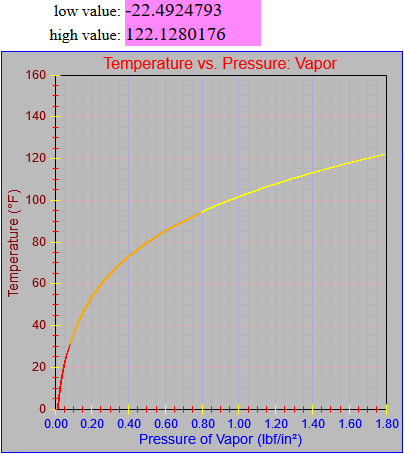
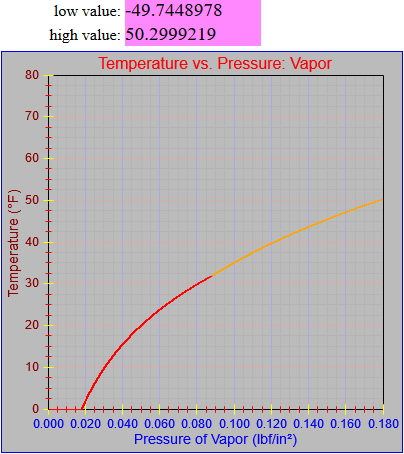
Generating plots over smaller and smaller ranges of pressure shows that each range of the function is smooth.
A way of getting these details to display is to do the plot on a logarithmic scale. I’ve done some of the work toward making that happen but that work will continue next week. I realize that I neglected to add this feature to the master list I created earlier this week, even though I was thinking about it. I’ve solved the basic parts of the problem but have to integrate the solution into the overall flow of code. As always, that may require breaking things apart into different functions. We’ll see how it goes.