
I was able to get the x-axis drawn out in a logarithmic scale, get the plot drawn on the same scale, and do it in a somewhat modular fashion. It needs a few pixel-level tweaks still and to be replumbed to separate the relevant sections of code, but conceptually the hard problems are solved.
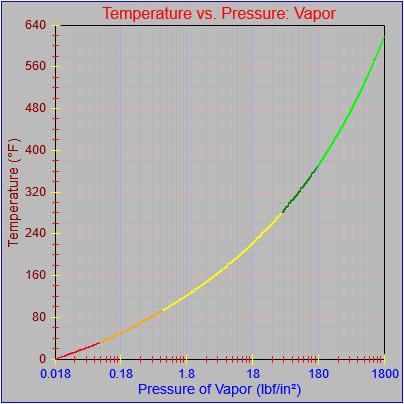
In this mode you can clearly see the different sections of the plot in different colors.