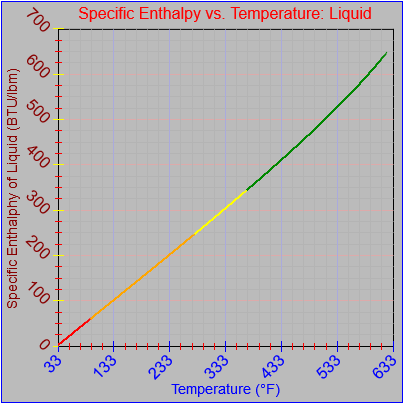
Today the X-axis tick value labels can be rotated, though I may need to rethink what the angles actually mean. Also, a bit of spacing has been added to let the presentation breathe and some gentler colors were chosen for the gridlines in the graph area.