
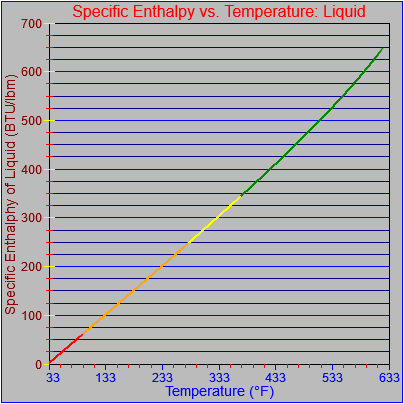
Today I reorganized things so that the location of the graph axes are calculated automatically. The first image just shows the typical arrangement of items in their normal sizes.
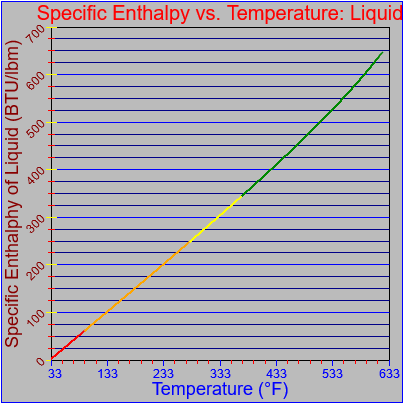
The graph and axis labels are larger in this image.
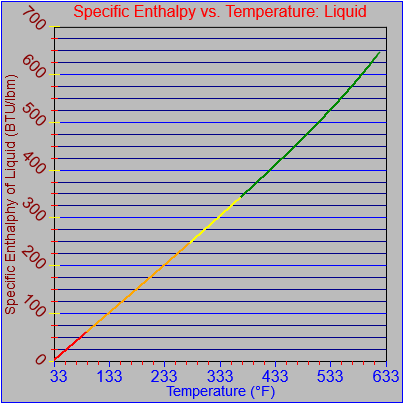
In this image the graph and axis labels are back to their original size but the axis value labels are larger. In this case in particular you can see that the top value on the y-axis requires more clearance than the top graph label so there is extra space below the top graph label. If the y-axis text were tilted the other way there could be extra clearance at the bottom of the graph if the lowest value text was sufficiently long.
Next up is to reflect all functionality from the y-axis to the x-axis and make a few other tweaks. Then I can start adding different plotting functions and the ability to display axes on either side of the graph and also add additional vertical axes.