
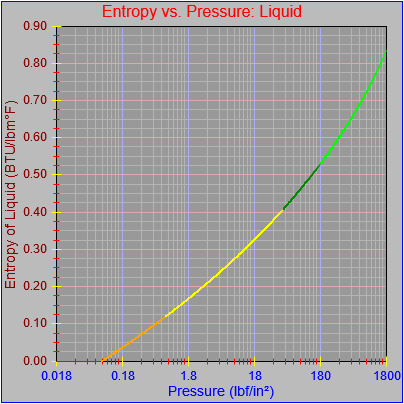
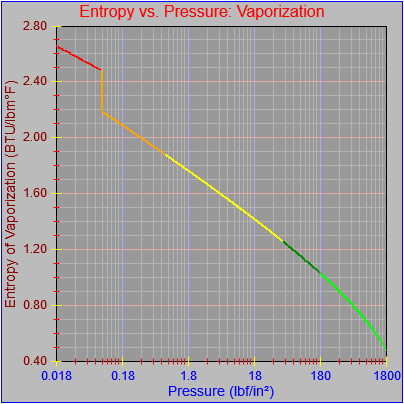
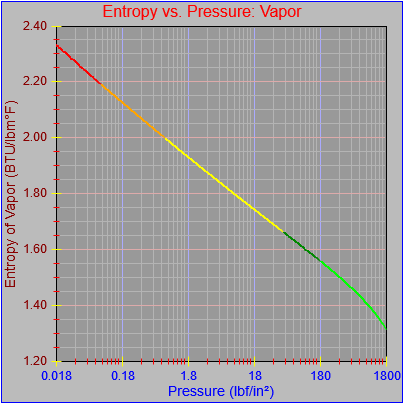
I was getting ready to do new curve fits on all the segments of the thermodynamic functions that seemed to require it. However, I realized that I hadn’t yet plotted them all out as a function of pressure since I finished making logarithmic scales work. Ergo, the figures below.
Except for the previously discussed chicanery regarding values at very low pressures and temperatures (below the triple point at 32.018 °F and 0.08866 psi), that I built in for use in a specific model from data and for reasons I can’t remember, this set of functions didn’t seem to include any obviously wayward segments. That said, I might revisit the segments between 180 and 1800 psi for a couple of the functions. At the very least I’ll plot them on larger graphs and as isolated segments to enhance the available detail.
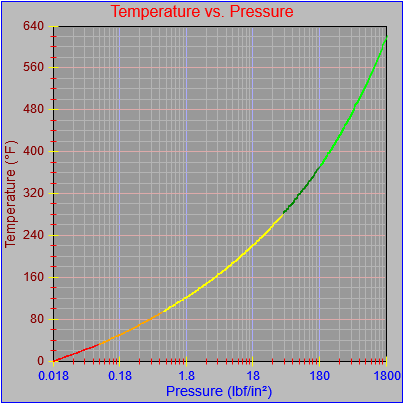
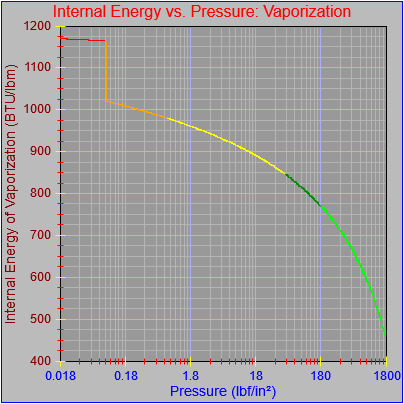
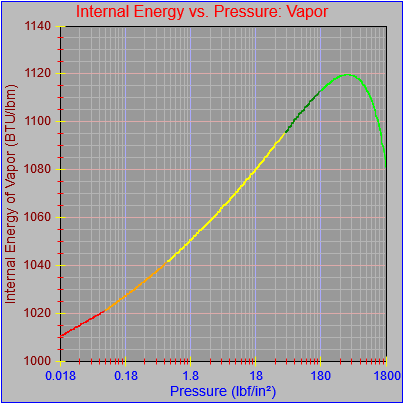
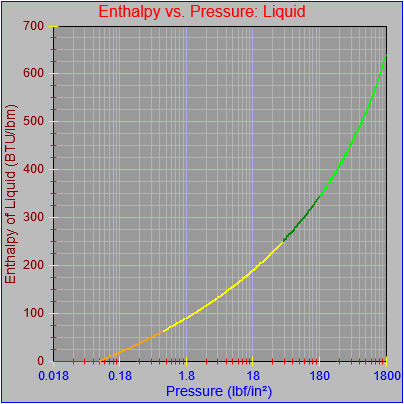
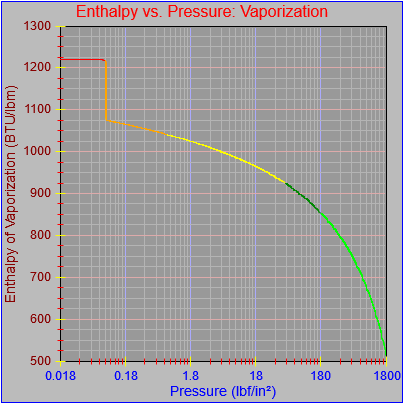
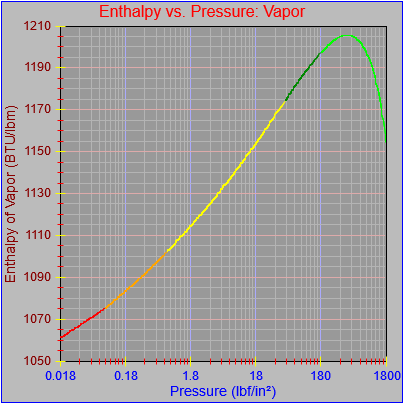
As an aside, I also noticed that most of the curves didn’t seem to be plotting out their final value at the far right pixel on each graph. This got me a bit frustrated because I thought I’d fixed that. However, the issue turned out to be our old friend the rounding error, which I had fixed for one of the functions (Temperature vs. pressure, which is evident in the first figure here) by adding a tiny buffer to the range the segment equation applied to (1800.0000001 rather than just 1800.0). This arises when performing successive additions to the independent variable as the drawing function traverses the x-axis pixel-by-pixel and ends up with a value of something like 1800.000000000036, which would fail the test of being less than or equal to the maximum value that could be plotted on the chart (1800.0). If the curve (or the function that defines it) continued beyond the high value for the graph then there wouldn’t be a problem, but in this case the high value for the graph and the curve were the same.
I believe that the solution to this problem, rather than adding a nudge to the curve definition (e.g. 1800.0000001), I might add a test to see if the final value is some tiny fraction over the maximum value and then bump it back, though such a solution might not always be appropriate if I don’t know much about the function being plotted. When I did the nudge for plotting the final major tick at the end of an axis I knew that I was looking for a whole number near seven, so the solution was appropriate. In this case it might not be. I’ll have to think about it for a while.
The bottom line, however, is that someone employing these tools has to be aware of all the edge cases. I try to address as many as I can in the code, but the code can’t always catch everything. This is especially true as new users employ new use cases that haven’t yet been encountered.