
Today’s work involved getting the plot area to size itself properly when the last major tick on an axis does not fall right at the end of the axis. It turned out to be just a bit complex and it did involve iteration, as expected, but the number of iterations appears to remain small. I will doing further testing in the future to see, for example, how many iterations might be needed to handle three axes in one direction that all end in partial cycles. I’m also wondering if it is possible for the solution I developed to exhibit a “chatter” effect, where the iterations continue as the sizing result jumps back and forth by a pixel or two. I will report back if I find anything.
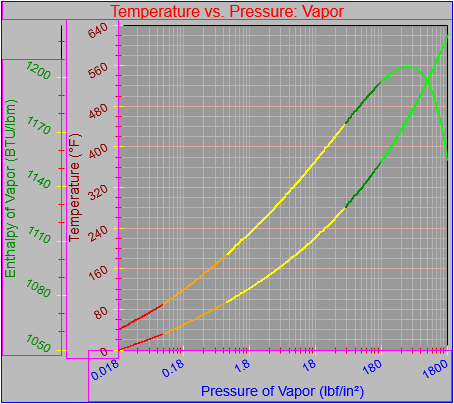
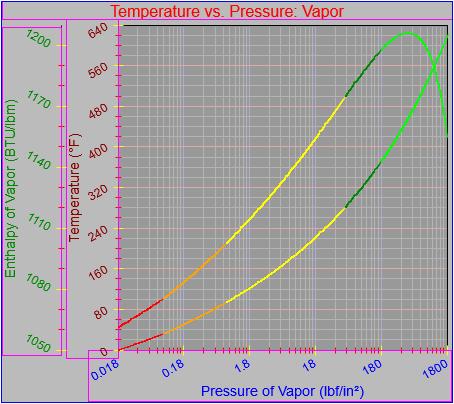
In the meantime the following images show how adjustments to the secondary y-axis scale, which ends in a partial cycle (between major ticks) ultimately allows it to become the element that governs spacing for the top edge of the plot area.
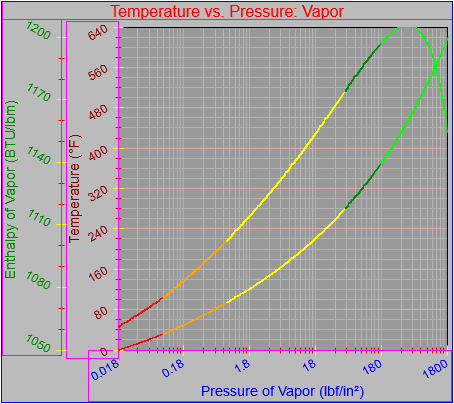
As a side note I identified the need to fix the plotting on the y-axis so it did not overrun the plotting area by one pixel on the high end. The third image shows the correction.
Also, notice that for the time being the solution only works for axes increasing in value from bottom to top (for the y-) and left to right (for the x-), where the partial cycle can only occur at the high end of the scale. There are two possible complications to the current set-up. One is that I can (and ultimately will) add the ability to reverse the direction of the scale on any axis. That would mean that the partial ending cycle would be at the bottom of a y-axis and the left side of a right axis. The other possible complication, which I may or may not ever address, involves the ability to define a scale that does not begin on a major tick boundary. That situation might come up if I want to generate a graph like this (from the Lissajous Curve app by Ying-Chou Sun, found in the iTunes App Store), though in reality it does end at major ticks:
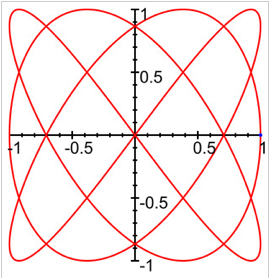
As I’ve noted previously, I do plan to allow axes to take up arbitrary positions within the plotting area, as they do in this example.