
Today’s updates involve ensuring that any number of axes can be properly placed on any side of the plotting area. Moreover, they will include space for tick marks that extend beyond the location of the axis itself.
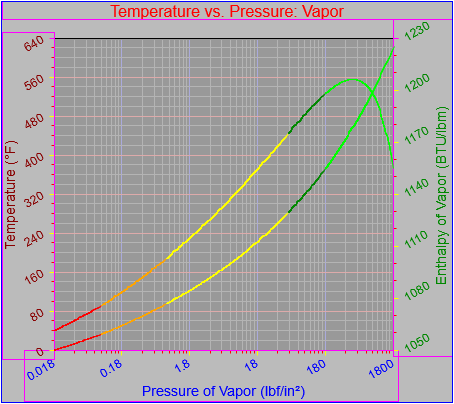
I also corrected a couple of other minor issues. One was forgetting a beginPath statement before drawing bounding rectangles (they normally wouldn’t be drawn except as an illustration), which had the effect of changing the color of the last major tick drawn on every axis. You see it corrected in the final image below. The other was realizing that there was not a one-pixel overlap between the space required for the graph label at the top of the canvas and any elements that bordered it, it only seemed that way because the bounding box was drawn one pixel too low.
The first figure shows that the overlap with the top section is now corrected, and also that the spacing works as desired with the x-axis in the low position as well as the high.
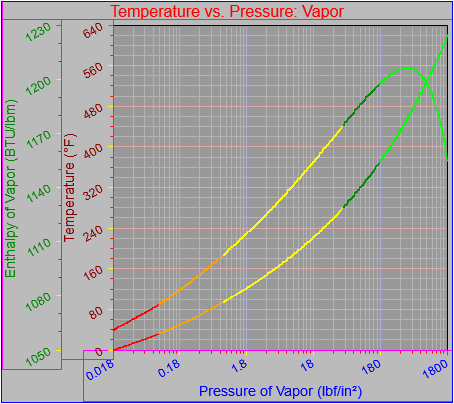
The next figure shows that multiple axes can be placed on any side of the plot area and be spaced correctly. I initially thought it was going to more complex than it turned out to be, but I happily saw a way to insert just a few extra lines of code into an existing block.
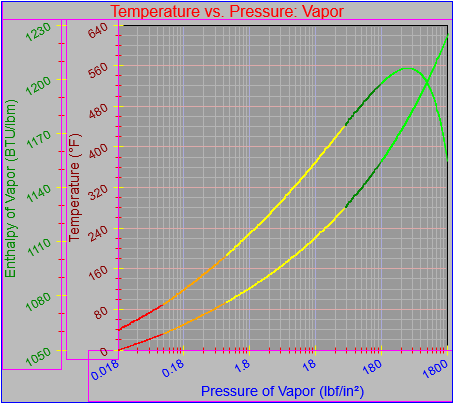
The final figure shows that spacing of multiple axes on any one side of the plot area will properly allow space for ticks that extend inside an axis (axisTickStyle == “in” or “both”) and that the issue with accidentally changing the color of the last major tick has been corrected.
The last thing to do for this phase of development is extend the code so it properly handles cases where the final major tick does not fall at the end of an axis. That should be addressed tomorrow.