
Today I’ll describe the sizing of characters so the graph object knows exactly how to place them. I hacked together a tool that prints out letters in a specified font and then draws horizontal lines at various offsets from the baseline. A section of that output is shown below:
![]()
Looking at the output in a magnifying glass shows how the different characters are laid out. If you were to draw a single character using the fillText function and set the x and y coordinates with left alignment, you’d get output like that shown below. The light green pixel shows the base X and y locations you specified and the values shown in the margin are offsets from that base point.
![]()
The base row of pixels for each character is mostly drawn one pixel up from the location specified (the green row). The red line is drawn one row of pixels above the top of each character. The blue line of pixels is drawn one row of pixels below the bottom of the descenders.
Rerunning that exercise for Arial fonts from 4px to 30px allowed me to build the following table.
![]()
Remembering that the numbers 0 through 9 don’t have descenders, we see that the 12px Arial digits are drawn between vertical pixels -1 and -9 inclusive, so the actual characters are 9 pixels high. A full-height character would span from 1 to -9 inclusive, which would be 11 pixels high in total, or 13 if the bounding box is included. There isn’t a one-to-one correspondence between specified pixel size for a font and its actual pixel size, though it’s close. The differences are biggest for the smaller specified sizes and decrease as the fonts get larger. It may be that the pixel height of the bounding box is always equal to the specified pixel size for fonts sized 24px and up.
In the course of my research I noticed a discussion of assigning character heights by point size instead of pixel size (e.g., 12pt vs. 12px), where someone stated that points are more accurate. I’d have to repeat this analysis to see, but that’s not going to happen today.
The next item in the queue is to determine the effective height and width of rotated text. That process begins once we know the size of the bounding box for said text.
The process for rotating elements on a canvas is a bit backwards from how I originally learned how to do it. I am used to translating the individual element to the origin (or whatever point I actually want it to rotate around), performing the rotation, and then translating the element back to its original location. The mathematical operations are performed on a copy of the object based on its native dimensions in “model” space. How the object is drawn on screen is a translation from model space to screen space.
In order to rotate items on a canvas object you apparently save the context, do a translation (with values that seem to have the opposite sign of what I would expect, though I’m sure the designers did this to make the operations more approachable for those who don’t know what’s going on behind the scenes), perform the desired rotation on the entire canvas, draw the desired element around what is now considered coordinate 0,0, then restore the original context. It may be that the code isn’t actually doing anything with the information on the canvas while things are being rotated, but doing this way feels impossibly weird and wasteful. Nonetheless if you follow the steps as shown you get the results you want.
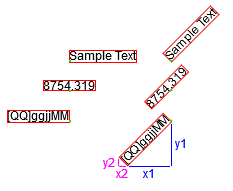
In the figure below I’ve worked out the code to draw three bits of text, with their bounding boxes, each normally and then rotated counter-clockwise by 45 degrees. The top example is left justified, the next example is centered, and the bottom example is right justified. The green point (actually the upper left pixel of it) shows the coordinate that defined the base location of the textFill operation and also the point about which the text was rotated. You can adjust things up or down by a few pixels to do the rotation around a point in the middle of the text with respect to its height.
OK, now that we know how to draw the box rotate it, we need to be able to figure out how much space it’s going to take up on the unrotated screen. With that information we can calculate the margins between the edges of the graph area (and axes and tick marks) and the edges of the canvas itself. Then we can work out any minor adjustments.
The x dimensions as shown are the width or height of the bounding rectangle multiplied by the cosine of the angle of rotation. The y dimensions as shown are the height or width of the bounding rectangle multiplied by the sine of the angle of rotation. The sum of x1 and x2 is the total number of pixels covered across the width, and y1 plus y2 is the total number of pixels covered across the height of the text. Once you know that you can make the slight adjustments to any tick marks and so on. If you’re always going to rotate by the same amount you can calculate the sine and cosine values once each and then apply them where needed. If the only rotation you’ll allow is 45 degrees as shown then you can use the constant value (0.7071067812) for both the sine and cosine.
Note that the dimensions only consider the bounding box. The methods described don’t consider whether the characters drawn will set pixels near any particular corner but I don’t think it matters and it would be madness to try. Indeed, you will get more consistent results by not worrying about that detail and placing all of your items in the same way.
Note also that you don’t have to go through the hassle of drawing out the bounding boxes. I only drew those to illustrate the process. You get the base width of the text from the measureText function, the height from the table (or some other method), and the angle from your own definitions. I’m guessing that in most cases you’ll want to right-justify your text and place your items just to the left of or just below the tick marks on the x- and y-axes, possibly with a minimal offset.
I’ve created a jsfiddle here to demonstrate the scripting code in action. It includes the code used to draw the font detail above and the rotation examples. It isn’t the cleanest, but it works.
Finally, I think it would be a good idea to back up and actually implement the basic graph as an object rather than try to account for every possible option up front, so that’s what I’ll present on Monday.