
Ongoing Monitoring, or, What’s Happening Now?
Any system with multiple processes or machines linked by communication channels must address real-time and communication issues. One of the important issues in managing such a system is monitoring it to ensure all of the processes are running and talking to each other. This is a critical (and often overlooked) aspect of system design and operation. This article describes a number of approaches and considerations. Chief among these is maintaining good coverage while keeping the overhead as low as possible. That is, do no less than you need to do, but no more.
First let me start with a system diagram I’ve probably been overfond of sharing. It describes a Level 2, model-predictive, supervisory control system of a type I implemented many times for gas-fired reheat furnaces in steel mills all over North America and Asia.
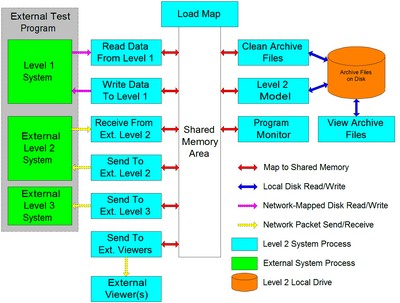
The blue boxes represent the different running processes that made up the Level 2 system, most of which communicated via a shared memory area reserved by the Load Map program. The system needed a way to monitor the health of all the relevant processes, so each of the processes continually updated a counter in shared memory, and the Program Monitor process scanned them all at appropriate intervals. We referred to the counters and the sensing of them the system’s heartbeat, and sometimes even represented the status with a colored heart somewhere on the UI. If any counter failed to update the Program Monitor flagged an alarm and attempted to restart the offending process. Alarm states were displayed on the Level 2 UI (part of the Level 2 Model process) and also in the Program Monitor process, and were logged to disk at regular intervals. There were some additional subtleties but that was the gist of it. The communication method was straightforward, the logic was dead simple, and the mechanism did the job.
This was effective, but limited.
This system was great for monitoring processes running on a single machine and regularly logging the status updates on a local hard disk. Such a system should log the time all processes start and when they stop, if the stoppage can be sensed, otherwise the stoppage time should be able to be inferred from the periodically updated logs.
This kind of system can also log errors encountered for other operational conditions, e.g., temperatures, flows, or pressures too high or low, programs taking too long to run (model slipping real-time), and so on, as well as failures trying to connect with, read from, and write to external systems over network links. External systems, particularly the main HMI (Level 1 system) provided by our company as the main control and historical interface to the industrial furnaces, needed to be able to monitor and log the health and status of the Level 2 system as well.
If all the communications between Level 1 and Level 2 were working, the Level 1 system could display and log all reported status items from the Level 2 system. If the communications are working but one or more processes aren’t working on the Level 2 side, the Level 1 system might be able to report and log that something is out of whack with Level 2, but it might not be able to trust the details, since they may not be getting calculated or reported properly. Please refer to yesterday’s discussion of documenting and implementing inter-process communications to get a feel for what might be involved.
The point is that one needs to make sure the correct information is captured, logged, and displayed, for the right people, in the right context.
If a system is small and all of the interfaces are close together (the Level 1 HMI computer and Level 2 computer often sat on the same desk or console, and if that wasn’t the case the Level 2 computer was almost always in an adjacent or very nearby room) then it’s easy to to review anything you might need. This gets a lot more difficult if a system is larger, more dispersed, and more complicated. In that case you want to arrange for centralized logging and monitoring of as many statuses and operations as possible.
Let’s look at a general case of what might happen in one local computer and one connected, remote computer, with respect to monitoring and logging. Consider the following diagram:

Note that the details here are notional. They are intended to represent a general collection of common functions, though their specific arrangement and configuration may vary widely. I drew this model in a way that was inspired by a specific system I built (many times), but other combinations are possible. For example, one machine might support only a single process with an embedded communication channel. One machine might support numerous processes that each include their own embedded communication channel. The monitoring functions may operate independently or as part of a functional process. Imagine a single server providing an HTTP interface (a kind of web server), supporting a single function or service, and where the monitoring function is most embedded in the embedded communication channel. One may also imagine a virtualized service running across multiple machines with a single, logical interface.
Starting with the local system, as long as the system is running, and as long as the monitor process is running (this refers to a general concept and not a specific implementation), the system should be able to generate reliable status information in real-time. If the local UI is available a person will be able to read the information directly. If the disk or persistent media are available the system can log information locally, and the log can then be read and reviewed locally.
The more interesting aspect of monitoring system health and availability involves communicating with remote systems. Let’s start by looking at the communication process. A message must be sent from the local system to a remote system to initiate an action or receive a response. Sending a message involves the following steps:
- Pack: Message headers and bodies must be populated with values, depending on the nature of the physical connection and information protocol. Some types of communications, like serial RS-232 or RS-485, might not have headers while routed IP communications definitely will. Some or all of the population of the header is performed automatically but the payload or body of the message must always be populated explicitly by the application software. Message bodies may be structured to adhere to user-defined protocols within industry-standard protocols, with the PUP and PHP standards defined by American Auto-Matrix for serial communication with its HVAC control products serving as an example. HTTP, XML, and JSON are other examples of standard protocols-within-protocols.
- Connect: This involves establishing a communications channel with the remote system. This isn’t germane to hard-wired communications like serial, but it definitely is for routed network communications. Opening a channel may involve a series of steps involving identifying the correct machine name, IP address, and communications port, and then providing explicit authentication credentials (i.e., login and password). Failure to open a channel may be sensed by receipt of an error message. Failure of the remote system to respond at all is generally sensed by timing out.
- Send: This is the process of forwarding the actual message to the communications channel if it is not part of the Connect step just described. Individual messages are sometimes combined with embedded access request information because they are meant to function as standalone events with one sent request and one received reply. In other cases the Connect step sets up a channel over which an ongoing two-way conversation is conducted. The communications subsystems may report errors, or communications may cease altogether, which again is sensed by timing out.
- Receive: This is the process of physically receiving the information from the communications link. The protocol handling system generally takes care of this, so the user-written software only has to process the fully received message. The drivers and subsystems generally handle the accretion of data off the wire.
- Unpack: The receiving system has to parse the received message to break it down into its relevant parts. The process for doing so depends on the protocol, message structure, and implementation language.
- Validate: The receiving system can also check the received message components to ensure that the values are in range or otherwise appropriate. This can be done at the level of business operation or at the level of verifying the correctness of the communication itself. An example of verifying correct transmission of serial information is CRC checks, where the sending process calculates a value for the packet to be sent and embeds it in the packet. The receiving system then performs the same calculation and if it generates the same value then proceeds on the assumption that the received packet is probably correct.
I’ve drawn the reply process from the remote system to the local system as a mirror of the sending process, but in truth it’s probably simpler, because the connect process is mostly obviated. All of the connections and permissions should have been worked through as part of the local-to-remote connection process.
If the communications channels are working properly we can then discuss monitoring of remote systems. Real-time or current status values can be obtained by request from a remote system, based on what processes that machine or system or service is intended to support. As discussed above, this can be done via a query of a specialized monitoring subsystem or via the standard service interface that supports many kinds of queries.
In one example of a system I write the Level 2 system communicated with the Level 1 system by writing a file to a local RAM disk, that the Level 1 system would read, and reading a file from that RAM disk, that the Level 1 system would write. The read-write processes were mutex-locked using separate status files. The file written by the Level 2 system was written by the Model process and included information compiled by the Program Monitor process. The Level 1 system knew the Level 2 system was operating if the counter in the file was being continually updated. It knew the Level 2 system had no alarm states if the Program Monitor process was working and seeing all the process counters update. It knew the Level 2 system was available to assume control if it was running, there were no alarms, and the model ready flag was set. The Level 1 system could read that information directly in a way that would be appropriate for that method of communication. In other applications we used FTP, DECMessageQ, direct IP, shared memory, and database query communications with external systems. The same considerations apply for each.
An HTTP or any other interface might support a function that causes a status response to be sent, instead of whatever other response is normally requested. Status information might be obtained from remote systems using entirely different forms of communication. The ways to monitor status of remote systems are practically endless, but a few guidelines should be followed.
The overhead of monitoring the status of remote systems should be kept as light as possible. In general, but especially if there are multiple remote systems, a minimum number of queries should be made to request current statues. If those results are to be made visible to a large number of people (or processes), they should be captured in an intermediate source that can be pinged much more often, and even automatically updated. For example, rather than creating a web page each instance of which continuously pings all available systems, there should be a single process that continuously pings all the systems and then updates a web dashboard. All external users would then link to the dashboard, which can be configured to automatically refresh at intervals. That keeps the network load on the working systems down as much as possible.
Logging, or, What Happened Yesterday?
So far we’ve mostly discussed keeping an eye on the current operating state of local and remote systems. We’ve also briefly touched on logging to persistent media on a local machine.
There are many ways to log data on a local machine. They mostly involve appending a log file with increments of data in some form that can be reviewed. In FORTRAN and C++ I tended to write records of binary data, with multiple variant records for header data to keep the record size as small as possible. That’s less effective in languages like JavaScript (and Node and their variants), so the files tend to be larger as they are written out in text in YAML or XML or like format. It is also possible to log information to a database.
A few considerations for writing out log files are:
- A means must be available to read and review them in appropriate formats.
- Utilities can (and should be) written to sort, characterize, and compile statistical results from them, if appropriate.
- The logs should have consistent naming conventions (for files, directories, and database tables). I’m very fond of using date and time formats that sort alphanumerically (e.g., LogType_YYYYMMDDD_HHMMSS).
- Care should be taken to ensure logs don’t fill up or otherwise size out, which can result in the loss of valuable information. More on this below.
Logging events to a local system is straightforward, but accessing logs on remote systems is another challenge. Doing so may require that the normal communication channel for that system give access to the log or that a different method of access must be implemented. This may be complicated based on the volume of information involved.
It gets even more interesting if you want to log information that captures activities across multiple systems and machines. Doing this requires that all processes write to a centralized data repository of some kind. This can impose a significant overhead, so care must be taken to ensure that too much data isn’t written into the logging stream.
Here are a few ways to minimize or otherwise control the amount of data that gets logged:
- Write no more information to the logs than is needed.
- If very large entries are to be made, but the same information is likely to be repeated often (e.g., a full stack trace on a major failure condition), find a way to log a message saying something along the lines of, “same condition as last time,” and only do the full dump at intervals. That is, try not to repeatedly store verbose information.
- Implement flexible levels of logging. These can include verbose, intermediate, terse, or none. Make the settings apply to any individual system or machine or to the system in its entirety.
- Sometimes you want to be able to track the progress of items as they move through a system. In this case, the relevant data packages can include a flag that controls whether or not a logging operation is carried out for that item. That way you can set the flag for a test item or a specific class of items of interest, but not log events for every item or transaction. Flags can be temporarily to data structures or buried in existing data structures using tricks like masking a high, unused bit on one structure member.
- If logs are in danger of overflowing, make sure they can roll over to a secondary or other succeeding log (e.g., YYYYMMDD_A, YYMMDD_B, YYMMDD_C, and so on), rather than just failing, stopping, or overwriting existing logs.
Well, that’s a fairly lengthy discussion. What would you add or change?