When I reworked the axes as separate objects I’ve been setting the plotting area and label locations by hand, as a hack/placeholder until I got all the pieces working again. I’ve still got a bit to go, but for now I’ve fixed it so I can place the labels automatically spaced beyond the tick value labels plus a specified buffer, and then account for a buffer outside of that. I use the information compiled to calculate a total distance in pixels perpendicular to the axis that the axis elements and buffers require. The information about how far the tick value labels extend past the plot area in each direction (left/right or top/bottom) is also tracked correctly, as you can tell by how the information is used to draw bounding boxes (in purple).
I’ve decided that rather than relying on buffers defined from the outer edges of the applicable drawing region that I would instead rely on buffers defined around all outer edges of the axes themselves. I have a buffer defined for outside of each element in a perpendicular direction going away from the axis but I see I need to add them for each end along the axis as well.
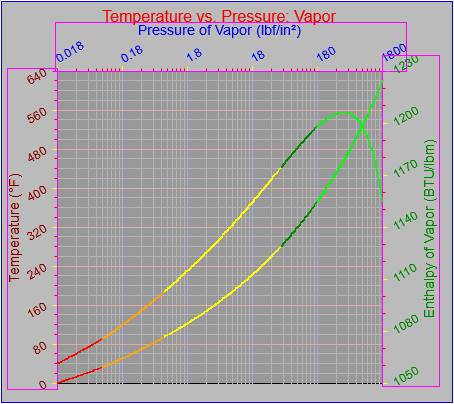
The current code also only calculates the overflow space off each end of an axis if major ticks fall right at the end of an axis, as they do in the accompanying figure. If a tick does not fall directly at the end of an axis the code then has to figure out how far away from the end it’ll be, which would not only reduce the overflow space, possibly to zero, but would also affect how the elements need to be placed. The issue is that the distance from the final major tick to the end of an axis is proportional to the length of the axis, but the placement of the axes might depend on the amount of overflow. The spacing calculations may therefore have to be performed iteratively, a process made even more complex by the possibility that multiple axes may be present. That should be a treat to figure out…
Once all of these items are implemented I can get to work on making all items place themselves from outside in and define the plot area which remains (and also determine if not enough space remains). I also have to make sure I account for whether the labels are drawn or not in the calculation of pixels required perpendicular to the axes. So far I’ve just assumed that they’re going to be drawn.
The current code assumes that x-axis labels (the main ones, not those for each tick value) will be printed in their normal, horizontal orientation while the y-axis labels will be displayed rotated counter-clockwise by 90 degrees whether the axis is displayed on the left (low) or right (high) side of the graph. If I decide to change that rotation to 90 degrees clockwise either by default or user parameter I’ll have to make a few more tweaks still. The placement of those labels requires that the height of the letters’ height and descenders be accumulated in the proper order. If I allow rotation in the other direction I’ll have to reverse things and add more switches.
I need to tweak the placement of the bounding rectangle by a pixel or two here and there to ensure I’m summing up the perpendicular distances exactly right. At the moment it looks like I’m about two pixels too narrow. I’ll review that as part of tomorrow’s work.
Finally, I think I may also shorten the tick lines drawn across the plotting area by a pixel, so they don’t overlap the bounding line on the far side of the plot, as is seen here along the bottom edge.