
Most generally, a tool is a means of accomplishing some end. If one uses the right tool for the job it is a more efficient and effective means than other alternatives. Naturally we’re always trying to use the optimal tool.
If a repetitive series of operations can be identified then a tool can be built to carry out the steps automatically. Building a tool makes sense when the effort needed to create it is less than the time that would be saved by doing the operations by hand. The more the operations need to be carried out, or the greater the possibility of making mistakes, the more justification there is for the tool, and the better the tool should be.
A tool can also hide a lot of details from its users, which could be a good or bad thing. It’s good in that it allows less skilled practitioners to carry out complex or repetitive operations quickly and with a high degree of success. It’s bad when the details and knowledge that are obscured lead to problems and, even worse, lost opportunities.
I’ve created tools and worked with teams that did so, and always found those efforts to be the most satisfying in software development. Every software program is a tool to some degree; it serves as a means to an end and in most cases is meant to do something repetitively. That said, when the software system is an end product I don’t see it the same way. Extremely general products like word processors, spreadsheets, and programming languages are also tools, but here I am talking about systems with more targeted applications. I am most interested in tools that allow me to build the end products more quickly. In sort, I am interested in tools that build software or components of software systems. These can take many forms.
Baby CAD program: The first “tool” I ever built was a little vector graphics editor for a computer graphics class in college. We started learning from the ground up: addressing individual pixels; drawing lines, curves, circles and ellipses, and text; combining elements into polygons, shapes, and larger entities; performing 2D and 3D transforms like translation, scaling, shearing, and rotating; clipping; filling polygons; and hidden line and surface removal. Along the way we built little programs that allowed users to define simple and compound elements and then manipulate them. They had menus, keyboard commands, read and saved files, printed images, and so on.
Interactive System to Help Students Solve Engineering Problems: I worked on this system for one of my professors for two semesters. It was based on the graphics program described above but was intended to walk mechanical engineering students through the process of solving certain classes of engineering problems. It had a “natural language” interface (artificial intelligence was a big deal at that time but as a practical matter all the system did was look for keywords in the text the students entered). The problem was presented to the student in the manner found in textbooks: a block of text gave the parameters and described the solution desired and a diagram was provided for further explanation and clarity. It contained an equation editor (which did clever things like create integral symbols out of multiple ASCII characters). The student was supposed to type natural language commands that would be used to carry out steps in the following order: provide a frame of reference for the problem by defining axes, control surfaces or control volumes, and so on; apply the appropriate engineering equation(s); make assumptions about which terms do not apply; solve the equation(s) for the desired answer; assign values to the relevant terms of the equation(s); and calculate the final answer. The system could save problems to files and retrieve and present them in a modular way, test to see that each step was carried out correctly and in the proper order, give feedback when the wrong thing was done, and provide help if the user was stuck. The pieces were pretty primitive, as you can imagine, but they were all more or less there.
Automated Player Character Record Sheets: At the risk of publicizing my intensely nerdy side… I had several different computers when I was in the Army and amused myself in my spare time by building tools to manage the information associated with D&D player characters. The controls stored information about all of a character’s abilities, skills, and belongings. Over time this work evolved into a text-based windowing system, which was itself a tool, or at least a framework that could be leveraged. It was originally all keyboard-driven but I eventually incorporated mouse controls as well. I remember being amazed that it seemed to require a lot of data to define the location, content, and format of the various data entry fields and controls, but there was no more or less than what was needed. Every such system I’ve seen since has worked the same way.
Steam Table Properties Calculator
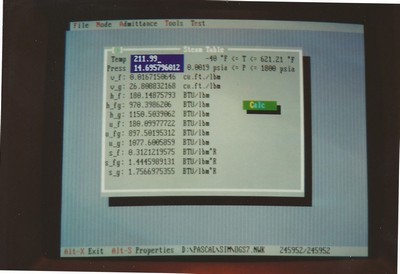
This was actually a combination of two tools, one for generating curves for the properties of saturated water and steam at different temperatures or pressures and one for curve fitting. The thermodynamic properties of water are described in steam tables with entries listed every few psi or degrees F (or other units of pressure and temperature). In school we always had to do linear interpolations of in-between values by hand, and in an industrial setting that just won’t do. It might be ok for design if you aren’t doing too many iterations but over time it starts to get painful. That method can also be surprisingly inaccurate in certain situations (e.g., at very low partial pressure of water vapor). In general it’s better if you can enter a single input and get a single output and be done with it.
Curve-Fitting Tool
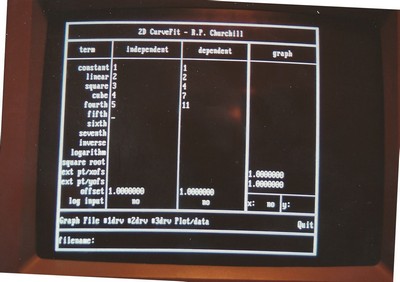
I got the curve-fitting idea from an article that got passed around the office while I was working at my first engineering job, where some of us had to do thermodynamic calculations regularly. The article described a curve-fitting technique that either came with one of the TI-50-series calculators or was implemented on one. It was based on an equation that was the sum of a constant, a linear term, a square term and similar terms up to a power of seven, an inverse term, a natural logarithm term, and a square root term. Without going into the gritty details (I’ll save those for a separate article), the tool allowed the user to enter a series of input and output values (X and Y values) along a section of the curve to be fit, and then solved a series of simultaneous equations which yielded coefficients for each of the terms. The plot would then be graphed, with the input points clearly marked. If the curve looked smooth then the fit could be accepted but if the curve wiggled between the input points, especially near one end, then the process had to be repeated with a different set of inputs and possibly different terms included or omitted. A little bit of software legerdemain allowed formulas with power terms to be written efficiently but I always felt that some of the formulations were computationally expensive. That said, they did work, and they were good enough for my intended uses. (The link below leads to several online calculators that do the same thing. These capabilities are no longer a novelty, as they were when I needed them.) By the time I stopped working on the tool I had added some extra tricks to try to smooth the inputs and outputs and had also made the program generate curve fits for the first three derivatives of the curve fit equations. That got a little hairy with some of the combinations of more complex terms.
Pressure Drop In Pipe Calculator
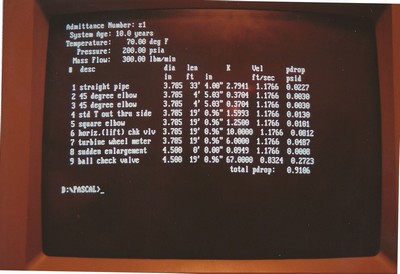
Early in my time at the Westinghouse Nuclear Simulator Division I wrote a tool to calculate the pressure drops in runs of pipe. The pressure drop was dependent on the properties of the fluid (mostly density and viscosity), the length of the pipes, the diameter of the pipes, the bends and diameter changes in the pipes, the equipment installed in that run of pipe (valves, orifice plates, and so on), and the relative roughness of the pipes. The basic equation was a variation I got from a colleague and the characteristics of most types of equipment were taken from Crane Technical Paper 410 (also see here), a famous industry standard. The interface was a simple text-based one, but it got the job done and was more than accurate enough for my uses.
Continuous Simulation Test Tool
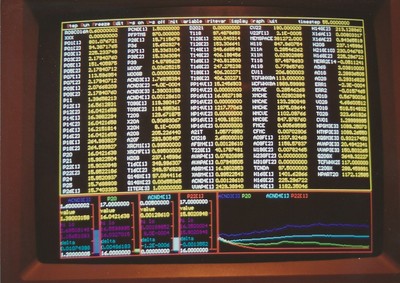
The simulators at Westinghouse were complex affairs with multiple CPUs, shared memory, multiple connected computers, massive amounts of I/O, and industrial tape and disk drives. They were expensive and were in use for one purpose or another almost around the clock. You could test individual programs in their somewhat native environment to a limited extent during the day, but doing so was slow and tedious. Modelers took turns exercising sole control of those systems only on the 11 pm – 7 am shift. I found that I needed to do a lot more testing, and I needed to do it a lot more quickly. I therefore found it necessary to write an entire continuous simulation test framework for a PC. Doing so also meant that I had to dummy in the behavior of variables and systems that were modified by other models. I learned a lot in the process and the framework I devised served me well for almost ten years.
Automated Fluid Model Documentation and Coefficient Generator
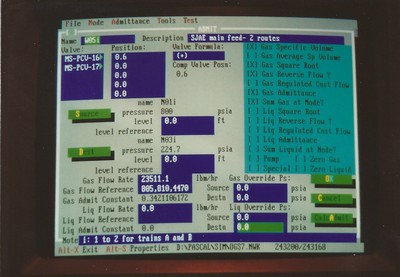
The project management process used by Westinghouse was solid overall (it was even rated highly in a formal audit conducted by consultants from HP while I was there) but that doesn’t mean there weren’t problems. One monkey wrench in the system caused me to have to rewrite a particularly long document over on several occasions. After about the third time I wrote a program that allowed me to enter information about all of the components of the system to be modeled, and the system then generated text with appropriate sections, equations, variable definitions, introductory blurbs, and so on. The system also calculated the values of all of the constant coefficients that were to be used in the model (in the equations defined) and formatted them in tables where appropriate. I briefly toyed with extending the system to automate the generation of model code, but the contract ended before I got very far.
Automatic Matrix Solution Code Generator
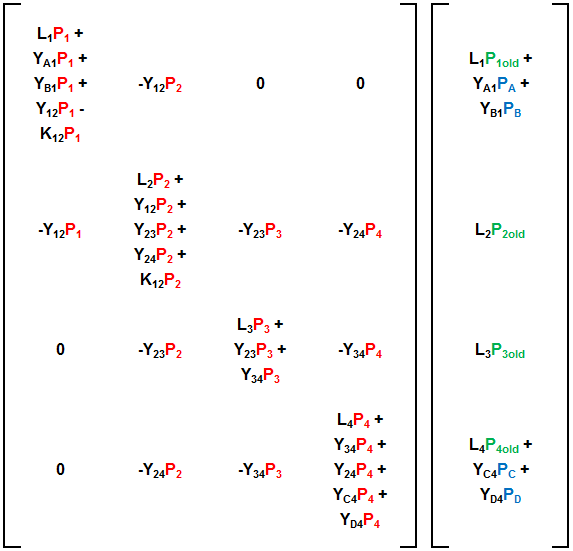
While working at Bricmont I ended up doing a lot of things by hand over and over. The control systems I built all did the same things in principle but the details of each application were just different enough that generalizing and automating their creation did not seem to make sense. If I had stayed there longer I might have changed my mind. I did leverage previous work by adapting it to new situations instead of building each system from scratch. That way I was at least able to identify and implement improvements during each project. There was one exception, however. I was able to automate the generation of the matrix solution code for each project. In general the block of code was always the same; there were only variances in the number and configuration of nodes and those could be handled by parameters. That said, the matrix calculations probably chewed up 80% of the CPU time required on some systems, so streamlining those bits of code represented the greatest possible opportunity to improve the system’s efficiency. To that end I employed extreme loop unrolling. That is writing all of the explicit calculations carried out by the tightly looped matrix solution code with array indices expressed as constants. In that way you get rid of all calculations having to do with incrementing loop counters and calculating indirect addresses. The method saves around 30% of execution time in this application, but at the cost of requiring many, many more lines of code. The solution to a 49×7 symmetric banded matrix expanded to 50,000 lines of code. The host system was way more constrained by calculation speed than it was by any kind of memory, so this was a good trade-off. The code was generated automatically by inserting write statements after each line of code in the matrix calculation — if that line performed any kind of multiplication or summation. The purpose of the inserted lines was to write the operations carried out in the line above in the desired target language (C++, FORTRAN, Pascal/Delphi at that time), with any array indices written out as constants. Run the matrix code once, it writes out the loop-unrolled code in the language of choice, done.
Modular Simulation of Medical Offices
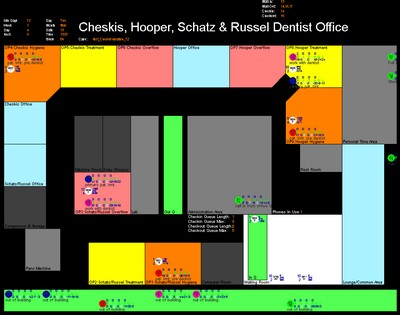
This tool allowed a user to define the floorplan, equipment, procedures, employees, patients, communications, and administrative activities of medical offices. The main cheats were that the location, size, and shape of rooms in the floorplan were defined by entering vertex coordinates by hand instead of using a graphical tool, and that I also did not show employees and patients moving from one place to another. I simply had them teleport and included a time delay. Beyond that the system provided a wide variety of outputs and served the desired analytical needs fairly well. If work on the project had continued there were numerous improvements that could have been made.
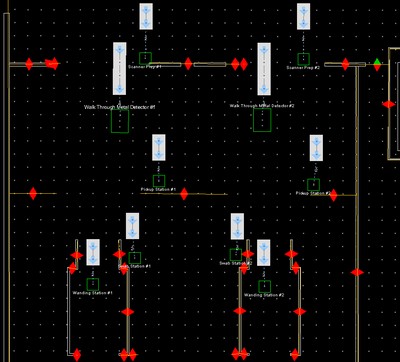
BorderWizard / SimFronteras / CanSim
These were tools used to build simulations of land border facilities for the United States, Canada, and Mexico. The layouts were defined by a CAD-like network of paths and processing stations. Arrival volumes and rates, process times, and diversion percentages were included based on data collected from field visits and automated records. The models were typically run for a week and might process up to 100,000 entities in that time. Simulation runs could take up to an hour. Unlike most of the other tools on this they were developed over a period of years by a large team of programmers and analysts. They were also end products used to support the analyses that were that company’s real products rather than an internal tool used to create some other product or component.
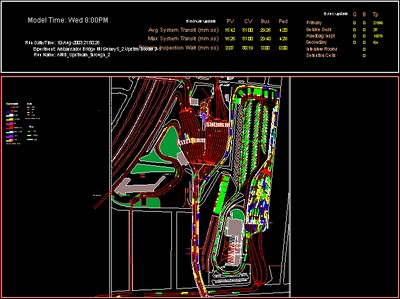
Pedestrian Modeling Tool(s)
This family of tools was developed by a large team over multiple contracts to define environments, facilities, processes, and the movements of goal-directed entities through them. The tools were sometimes used to test the effects of changing facility layouts or the configuration of steps in a defined process, but were most often used to model evacuation events. The evacuation models incorporated a wide variety of challenge effects the model occupants had to react to.
Budget Planning Tools: I created a number of spreadsheet tools over time, to do things like calculate the output characteristics of combined material flows, test and condition inputs to other models and processes, and size processing systems. The most modular of these, however, was the set of tools I created to manage the employees and contracts I supported as a program manager for four Naval aviation task orders. I had to manage the billing for labor and expenses and track all activities very closely, in order to prevent recurrence of the problems I had to overcome when I inherited the position.
Flight Schedule Generator
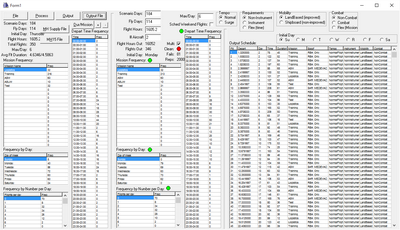
When spreadsheet tools proved insufficient for the task I spent a few days writing a program to read in files of historical flight records and write out randomly-generated flight schedules of defined calendar durations and flying hour rates that had the proper distributions of daily flight frequencies, mission types, flight durations, and departure times. The tool could also generate flight schedules with the desired output characteristics by hand-entering notional input data in the correct proportions.
Conclusion
I’ve always been fond of modular tools, toys, and games that can be configured and used in a variety of ways. They can be adapted to many different situations and generate a variety of outputs. When it comes to building and employing tools I have every type of experience related to defining what they need to do, managing their construction and use, understanding how they should be tested and modified, and knowing when and whether they make sense to build at all.