
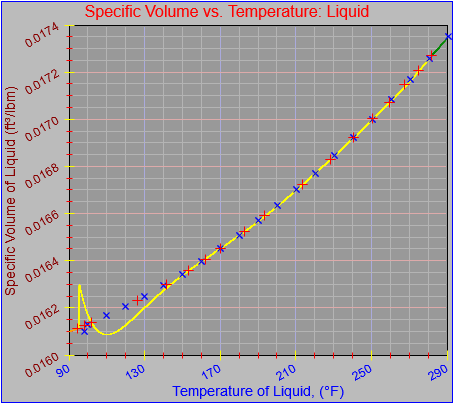
As you saw yesterday in the figure below, I’ve added the ability to plot individual points on the graph rather than a continuous function.
The x- and y- locations are determined independently by transforming a value to a pixel location against each axis. The axis to use has to be supplied to the plotting method, which is part of the Graph class. If a point (or curve) is to be scaled to a secondary axis or, indeed, any axis, a reference to that axis must be supplied to the plotting function. The plot function is a member of the Graph class, as stated, and the scaling functions for the axes are part of the axis class.
Ideally, what you have then is a procedure with the following steps:
- Perform any initialization for curves, processing of arrays, association with functions and ranges, and so on.
- Determine the x,y values to be plotted.
- If the function to be plotted is continuous then determine the value pairs for some or all of the pixels on the x-axis (or whatever axis is associated with the independent variable).
- If the function to be plotted from a known set of independent values then find the dependent values which correspond to them by executing the desired function.
- If the values to be plotted come from an already known set of x,y value pairs then arrange them into a data structure that allow them to be processed.
- Determine the pixel locations against the appropriate x- and y-axes independently.
- Perform the desired drawing operation based on the pixel location.
- If the function to be plotted is continuous then the curve will be extended with each successive operation.
- If the function to be plotted is based on individual data points (e.g., supplied from a list) then the individual symbols (or bars or whatever) will be drawn (or lines connected from point to point). Volumes may be filled in as required.
When I did the original quick and dirty hack I just buried some of the steps into the main method where the graph is drawn, but in truth the graph itself should be drawn by one method and the plotting functions should be called by using entirely separate methods.
Right now there is a function for step 1 to initialize continuous graphs. There is a sweep method for the continuous functions which embodies steps 2, 3, and 4, calling the scale and plot functions as needed. For individual data points the values are fed to the required methods individually (step 2), and then the scale/transform (step 3) and drawing operations (step 4) are called successively for each data pair.
I’m still working on ways to compartmentalize some of these functions. I want them to be as consistent as possible while also being callable from outside the method that draws the graph itself. As I think about it, the design I have is actually pretty close to what I think I will ultimately need, but I will continually revisit it as I find new ways to use the object and implement more different kinds of plots.