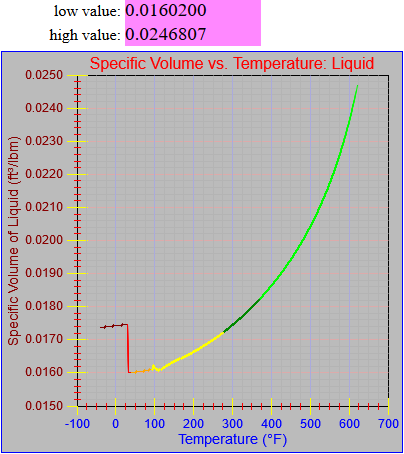
I’m finally detouring back to fixing the handful of errant segments in the steam table functions I created for my simulation work in the early 90s. This graph, originally posted on March 16th, shows a hiccup in the segment from 95 °F to 281.03 °F:
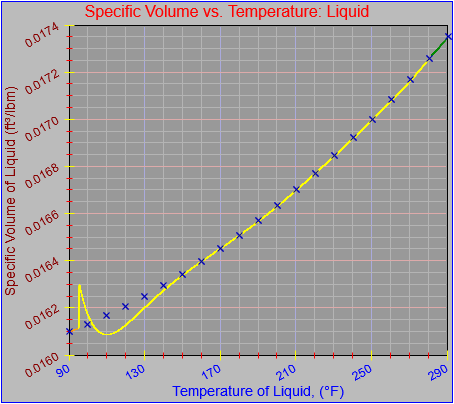
The first thing I did was plot the offending function segment using the graph object I’ve been working on. However, in this case I’ve added values taken from the steam tables at ten degree intervals. Most of the graph is fine except for the low end.
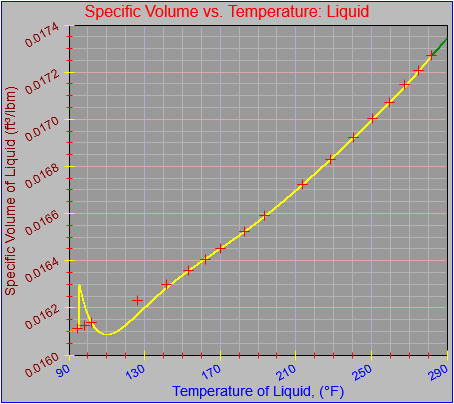
Recognizing that I originally built the function from entries that came from the pressure table (meaning that the values for the different properties are reported at even intervals of pressure, so the temperature values were unevenly spaced) so I would be using consistent ranges and possibly control points (more on that shortly), I went ahead and plotted the values from the pressure table instead, as shown here.
For completeness and then clarity I plotted both sets of values as shown here, first in a normal size, and again in a much larger size, which I have made scrollable.
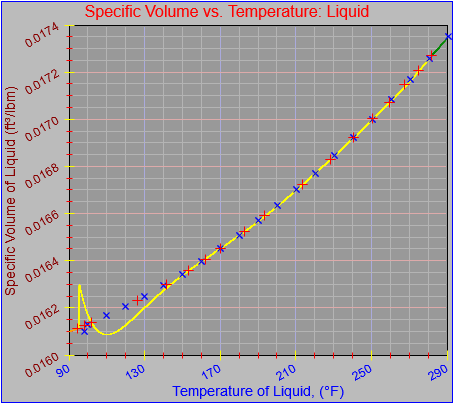
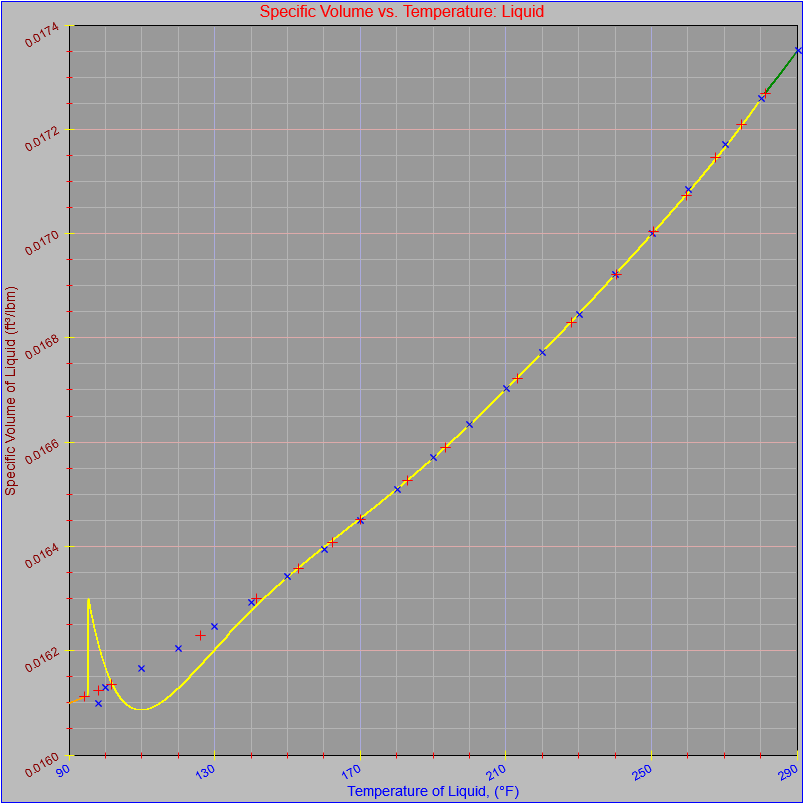
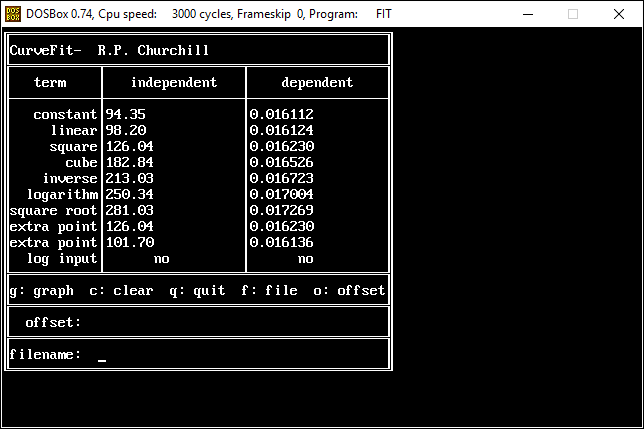
The locations of the red crosses on larger plot suggest which control points I used when I did the original fit. The fit program I used, several captures of which are shown below, works by solving a system of simultaneous equations of the following form:
Dep = A + B*Ind + C*Ind2 + D*Ind3 + E/Ind + F*LN(Ind) + G*SQRT(Ind)
where Ind and Dep are the independent and dependent variables (in this case temperature and specific volume of liquid) taken from the steam tables and A through G are coefficients that are solved for. The theory is that once you solve for the coefficients you can use the equation and an input value to generate an output value. Including a variety of terms of different forms captures many potential characteristics of the function.
I got the idea from an article that was passed to me at my first engineering job at Sprout-Bauer. I can’t remember where it came from, exactly, but I want to recall that it was from a magazine from the paper industry or chemical engineering. It described a function that either existed on or was implemented on a TI-59 calculator. Having seen the article I busted out my trusty copy of Turbo Pascal and went to town.
The program I wrote implemented a few extra twists. It included the ability to apply a LN function to the independent variable before it was entered into the equation and also the ability to apply a LN function to the result. That often helped smooth out some otherwise unruly curves. It also had the ability to add an offset to the input value, the intention of which was to subtract a fixed value from the independent values to make the fit start at a value close to zero. That is, instead of trying to do a fit from 459,624,593.006 to 459,624,604.731 you could subtract most of the value from the input so the fit would be from, say, 1.0006 to 10.731. In theory this would allow the computations to preserve more significant figures, which was important when you were working with only 32-bit floating point numbers.
Finally, the user could enter values in for some or all of the terms, and terms that were omitted were not used in the curve fit or the resultant equations. Once the calculations were done the program could plot the results (as shown below) and write out the functions or coefficients in various forms. The control points used, which correspond to the independent and dependent value pairs that were used as inputs to the system of simultaneous equation that gets solved for the coefficients, are plotted in dark blue on the graphs. The resultant function should pass through all of the control points. It’s what happens between the control points that gets interesting. Up to two extra points could be plotted in light blue, to show how much error might be creeping in.
I obviously set it up to write the function out in Pascal, but the thing could be made to write things out in any language desired. I may have to recreate the thing so I can get it to work more efficiently on a modern OS without having to run it in the DOSBox emulator, but I will revisit that idea down the line. Recreating the pouring demo was a bit of a slog already.
|
1 2 3 4 5 6 7 8 9 10 11 12 13 14 15 16 17 18 19 20 21 22 23 24 25 26 27 28 29 30 31 32 33 34 35 36 37 38 39 40 41 42 43 44 45 46 47 48 49 50 51 52 53 54 55 56 57 58 59 60 61 62 63 64 65 |
function TFind_v_f(T) { var temp = 0.0; if (T < -40.0) { graphCycle = graphCycleBottom0; temp = 0.0 } else if (T < 32.018) { graphCycle = 1; T = T + 4.00000000000000E+0001 + 2; temp = -2.77708350690104E-0006; temp += ( 1.38854175345052E-0006 * T); temp += 1.73700000000000E-0002; } else if (T < 42) { graphCycle = 2; temp = 1.5923528871E-02; temp += ( 1.0244487359E-05 * T); temp += (-3.3695449104E-07 * T * T); temp += ( 3.5308063678E-09 * T * T * T); } else if (T < 95) { graphCycle = 3; T = T + -3.1018000000E+01; temp += 1.5956056883E-02; temp += (-3.0780099353E-05 * T); temp += ( 1.9514192710E-07 * T * T); temp += (-7.1935918491E-10 * T * T * T); temp += (-2.6766927968E-04 / T); temp += (-3.3475459328E-04 * Math.log(T)); temp += ( 3.6419807311E-04 * Math.sqrt(T)); } else if (T <= 281.03) { graphCycle = 4; temp = 3.61500184567376E-0002 * T; //<<-This is the segment of interest temp += ( 6.69698774471181E+0001 / T); temp += (-1.40147509599046E+0000 * Math.sqrt(T)); temp += ( 4.45243090984150E+0000 * Math.log(T)); temp += (-2.12763372086644E-0005 * T * T); temp += ( 1.10736975867808E-0008 * T * T * T); temp += -1.05724332880491E+0001; temp += 1.61359999999888E-0002; } else if (T <= 373.13) { graphCycle = 5; temp = 2.15523225683864E+0000 * T; temp += ( 1.27661275928617E+0004 / T); temp += (-1.10859389820951E+0002 * Math.sqrt(T)); temp += ( 4.69625578319654E+0002 * Math.log(T)); temp += (-7.31226245377137E-0004 * T * T); temp += ( 2.22872590579029E-0007 * T * T * T); temp += -1.38783164038137E+0003; temp += 1.72689999999989E-0002; } else if (T <= 621.21) { graphCycle = 6; temp = 1.75454329191780E-0001 * T; temp += ( 1.86455914045125E+0003 / T); temp += (-1.04327091134473E+0001 * Math.sqrt(T)); temp += ( 5.11350007389556E+0001 * Math.log(T)); temp += (-4.46953363175684E-0005 * T * T); temp += ( 1.03124736379831E-0008 * T * T * T); temp += -1.66070870734518E+0002; temp += 1.82729999999935E-0002; } else { graphCycle = graphCycleTop0; temp = 0.0; } return temp; } |
I went ahead and tried to recreate the function with the following results. In each successive attempt I chose a greater concentration of control points near the lower end of the range. The form of the original function I derived shows that I used all seven available terms so I’ve done the same here.
Attempt 1:
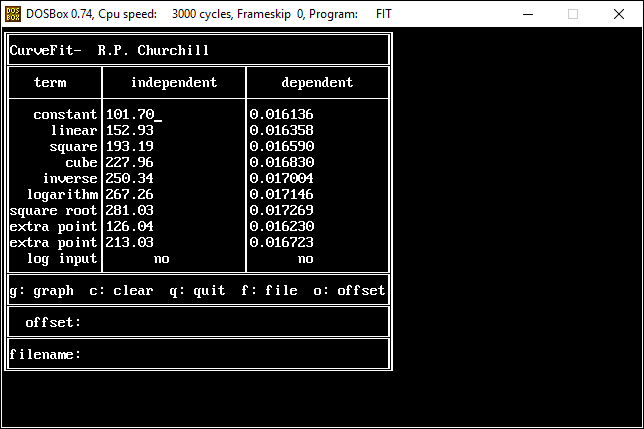
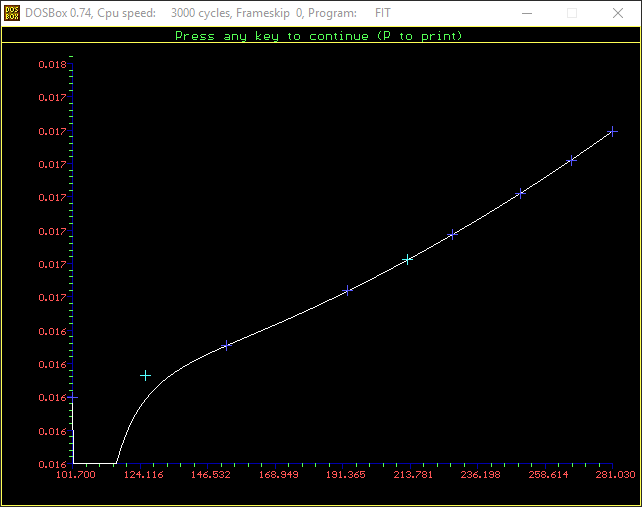
Attempt 2:
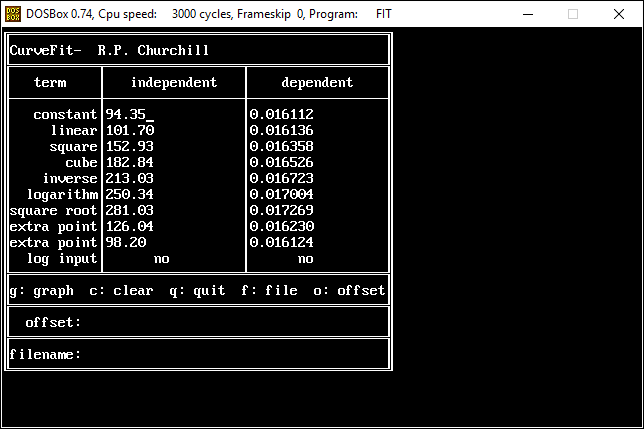
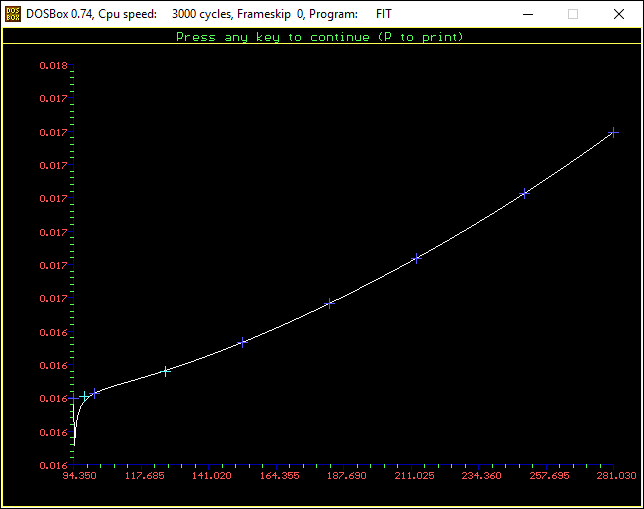
Attempt 3:
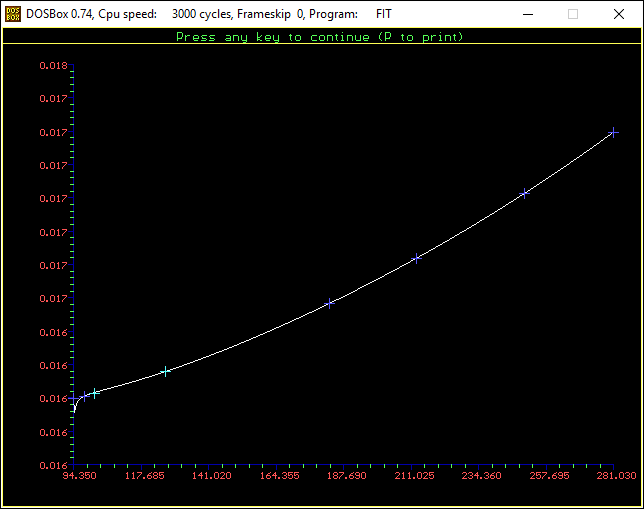
I also tried applying LN functions to the independent and dependent values but they didn’t solve the problem, either.
As you can see, this particular function does not want to behave. There are a few simple workarounds, however. One is to simply break the function into two or more ranges. Another is to use this function only for the range where the fit is good and extend the next lower range up to cover the missing range. Doubtless there are other solutions.
Going forward I’ll work through some of the other problematic functions and talk more about the curve fitting process, though tomorrow I will probably take time out to discuss the updates I made to the graph object.
