RTR Technologies, LLC – Aberdeen, MD, Lexington Park, MD 2010–2015
Senior Process Analyst, Senior Computer Scientist
Collected and analyzed data, researched and reviewed support operations, defined and implemented software framework modifications to address customer requirements, identified methods to prevent errors and improve accuracy, and presented results and recommendations. Supported Agile matrix as Scrum Developer and Product Owner.
- Analyzed aircraft logistics support operations as part of team using the largest GPSS/H discrete-event simulation model ever written and additional ad hoc techniques.
- Performed full-scope Verification and Validation (V&V) of software system designed to manage entire fleet of Navy and Marine Corps F-18 series aircraft per MIL-STD-3022. This effort led to successful Accreditation of the model.
- Performed Analysis of Alternatives (AoA) and Cost-Benefit Analysis (CBA) of specialized, high-volume processes.
- Reverse-engineered and specified redesign of major agency staffing model (27,000 staff, 100+ activities, 500+ locations) to improve accuracy, clarity, accessibility, and maintainability. Demonstrated that new model matched old across roughly 100,000 data values.
RTR Technologies was formed when it split away from Regal Decision Systems, my previous employer, about a year after I got there. Several people left Regal and went to RTR over time, and it was interesting to work with them again after several years apart.
RTR's support of analyses for the Navy was carried out as part of a team led by ManTech as the prime contractor. I was hired primarily to manage analyses of the then-not-yet-launched P-8A Poseidon naval reconnaissance aircraft using the Aircraft Maintenance Model (AMM). AMM is an operations research simulation written in the GPSS/H language. The /H represents a high-performance extension to GPSS that is managed by Wolverine Software. Versions of the AMM have been used to model Naval aircraft maintenance operations since GPSS ran on mainframes starting in the 1960s. Some of the owners of RTR and its most senior engineer (a very sharp emeritus type who supports the model one or two days a week even in his 80s; it was a real pleasure to work with him at RTR and at Regal before the split) have been working on AMM for most or all of its history. A new UI wrapper was written in Microsoft C# and was just entering use as I started working at the company.
The purpose of the model was to simulate all of the flight operations and inspection, repair, and supply actions associated with groups of aircraft over time. The rules for performing the inspections and repairs are defined in the NAMP (Naval Aircraft Maintenance Program). The frequency and duration of events are driven by detailed historical data supplemented by SME reports. Unscheduled events are generated using Poisson distributions based on historical data. Scheduled events are based on guidelines in the NAMP or procedures defined by the relevant management activity.
Understanding and employing the data has always been interesting. The data itself is somewhat messy. Some conditioning made it possible to fill in gaps where data was missing or incorrect, but sometimes the errors had to be accepted and their effects on the output accounted for. In other cases the data were correct but just difficult to work with because of their nature. In particular it can be difficult to analyze events which occur only rarely but have great impacts when they do.
There are complications with AMM that I'll touch on but won't describe in detail. The core code is decades old and not very cleanly structured. It is difficult to change because the team doesn't want to break anything and they can't redo it because of time, expense, and the need to re-prove the model's credibility. RTR's team manager has expressed his disappointment that more progress hasn't been made unsnarling the spaghetti; I'm not surprised at all... RTR's personnel do all of the software support, though ManTech has been angling to be involved for years. That speaks to just some of the tensions between the teams. The Navy is also starting to cap the rates that can be charged to its contracts. Between that, the limited hours of work the Navy wants to pay for, the competitive contracting environment, and the Navy's desire to bring more work in-house the contracting situation has become increasingly difficult. A lot of people, especially senior ones, are retiring (two members of the ManTech team just retired and a third plans to do so within the next year), changing industries, or accepting significant pay cuts.
The fact that some of the team members at RTR had previously worked at Regal led to some of the same kinds of difficulties. Taking shortcuts made some of the solutions brittle when applied to model other aircraft. I always favor representing all available options in an initial build than less. That said, the team also generated an increasingly robust solution over time, as well as one that included all of the options defined in the NAMP once the need for them was sufficiently clear. The team spent a great deal of time reconsidering and improving every aspect of the system on an ongoing basis. Even people who didn't work on the code directly had to have a very deep understanding of both the conceptual model and the instantiated model, as well as a deep understanding of the meaning and effects of all input and output data. I got to know the model at a very deep level, knew all about its pre-, during-, and post-processing operations, and continually maintained the major documents. Only a couple of the documents were used and distributed regularly; the rest were maintained in anticipation of supporting a major V&V of the system. That was talked about for years and to my knowledge still hasn't happened.
The product was managed using traditional and agile techniques, including a formal Configuration Management Board and versions of the typical Scrum ceremonies. The developers worked in sprints of 4–8 weeks about four times a year while minor tweaks and bug fixes were implemented continually. The team continually identified potential fixes and improvements and worked them in with modifications needed to support specific analysis requests.
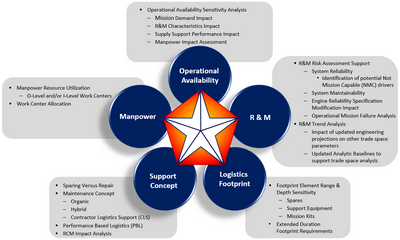
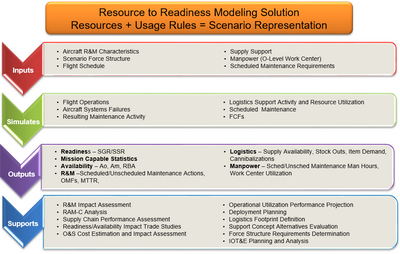
AMM supported analyses of an analytic tradespace that considers operational demand, availability, equipment grouping, supply, reliability and maintainability (R&M), staffing, and scheduled services requirements. Examining the effects of changes to any of these parameters was the basis of performing a wide range of higher-order analyses.
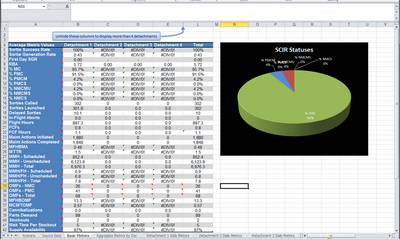
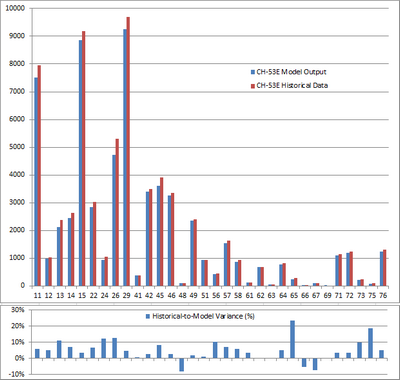
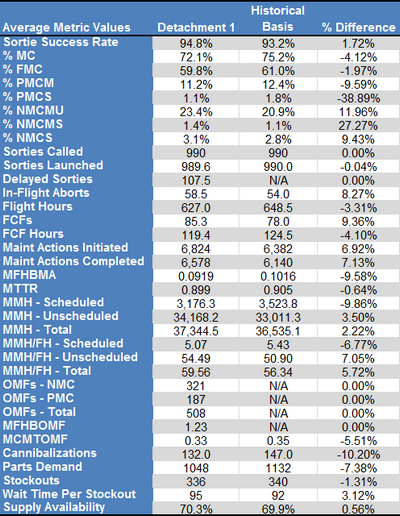
The tool generated compiled statistical outputs and logs of all activities. The logs were used to ensure the model was working correctly and, because the outputs in some cases were too large to be handled using Excel and Access, were then used to compile the statistical results in post-processing. Many outputs were generated automatically; custom outputs were hand-created for specific analyses when needed.
Understanding historical data, and the potential errors in the information that is actually recorded, along with projected future usage, was an ongoing challenge.
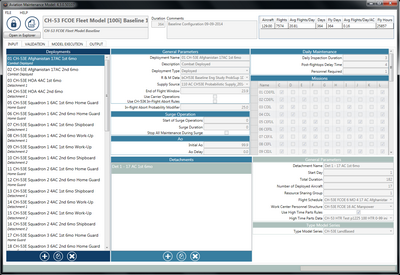
The new user interface wrapper, and the many validation checks that were included, made the entire framework much easier and faster to use.
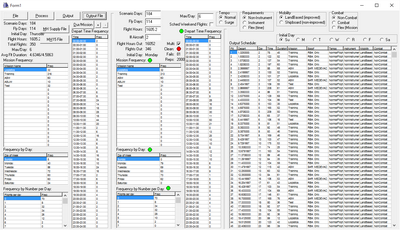
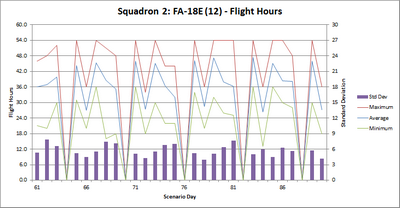
I wrote a standalone tool to generate flight schedules that had any desired combination of duration, number of aircraft, departure day and time, and mission types. They could be based on historical flight records that were read in from a file or on parameters entered directly by the user. It would output files ready to be converted into the format read by the model.
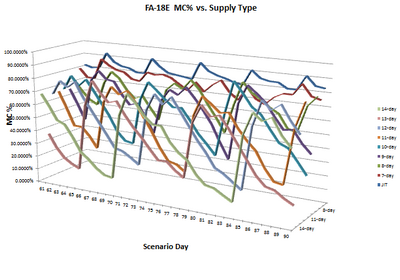
The team was always looking for ways to present data more effectively. These were some of my proposals.
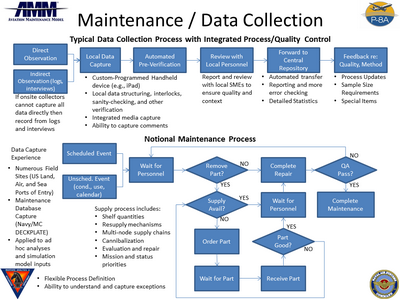
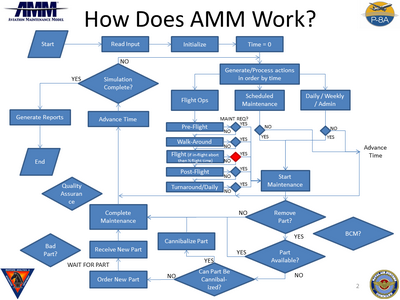
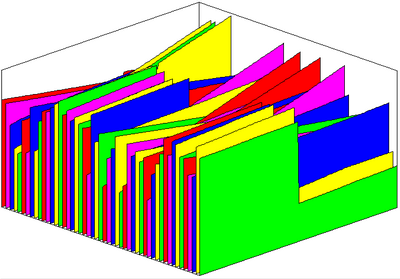
Over the years I created numerous diagrams showing process flows for the modeling team and states within the model itself.
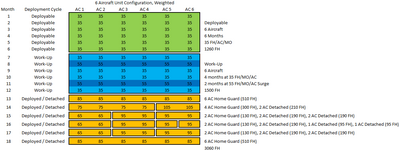
The team's long experience analyzing Naval aviation processes led to many different kinds of work. It spent about two years performing a full-scale Independent VV&A (Verification, Validation, and Accreditation) of a model meant to manage fleets of Naval aircraft. That model provided a means of specifying carrier schedules and then mapping air wings to carriers, squadrons to air wings, and individual aircraft to squadrons, all while balancing consumption of aircraft life and considering major depot maintenance operations, upgrades, and retirements.
The VV&A effort was complicated by the method we were directed to use. We were guinea pigs for a very senior government analyst's Navy-wide standard. Understanding what he wanted took a bit of effort, but I believe the framework was solid and I plan to use the core of it going forward. A description of the process is here.
The solution was created by a Design team (headed by a different analyst who was very impressive and dynamic and who got treated worse than badly by the Navy's contract administrators) and implemented by a separate Development team. The Design team wrote the analytical functionality for the two most important modules of the system in Python. Those components read in all of the important input information as files in the native formats generated by other Navy planning and analytic processes, and generated the outputs desired, some of which served as inputs to the process to support iterative updates. A few additional pieces of information were handled by support modules, the information for which was read in a slightly different format. The Development team created the final web-based system with a complex user interface. Part of the verification of the system was that the versions of the two main modules created by the Design and Development teams both read the same inputs and wrote the same outputs, and those outputs were compared item for item by an External Verification Module (EVM, a separate comparator was written for each of the two modules) specially written for that purpose. Even though the Design Team's implementation did not implement a web-based UI it did output information used to create the important parts of it, so even the graphical output characteristics could be compared. While demonstrating that two different implementations fully agree across scores of thousands of values cannot by itself prove that either implementation is correct, it does suggest that two teams working from a common set of requirements and inputs were unlikely to have made the same mistakes.
We ultimately completed the analysis and all documentation and our efforts, along with those of all team members and the Navy, resulted in a modeling system that was fully accredited for all intended uses. I participated in most phases of the effort and chaired the V&V team meetings for the last several months of the project, after the individual who worked for the prime had exhausted his funding and departed the company.
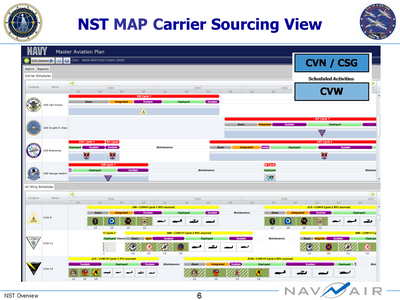
This is the web interface that shows some of the mapping. All data is notional.
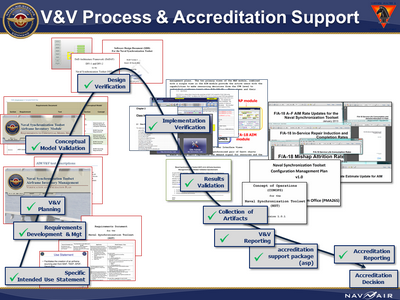
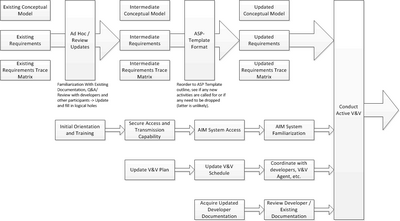
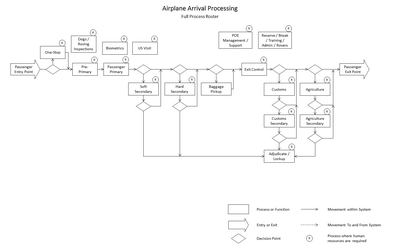
These items describe the flow of the IV&V effort.
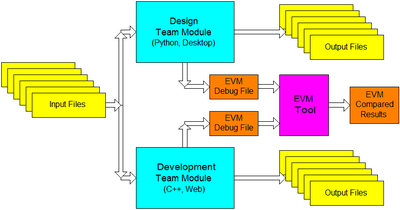
This diagram shows how the design system and the delivered system were compared across well over 100,000 individual data values.
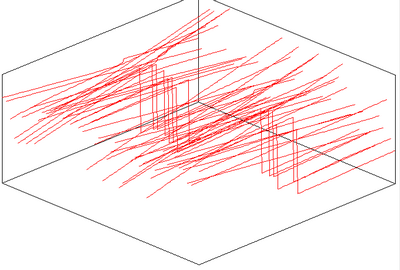
The team members' experiences at both Regal and RTR led them to begin construction of a new and more streamlined flow analysis tool. I spent some time thinking about the theoretical underpinnings, and generated numerous drawings illustrating the derivation of my thoughts. I always try to examine a problem as deeply as possible to find the lowest-level, unifying concepts on which any system is based, so the most general, modular system system can be built. There are reasons why the ideal system cannot be built in many cases, but if the system is properly understood the decisions on how to proceed can be taken with the greatest possible understanding of the trade-offs involved. The development team would also know enough to be able to build the minimum viable product, which could then be iteratively expanded to produce the full product while allowing the maximum amount of testing, review, and feedback.
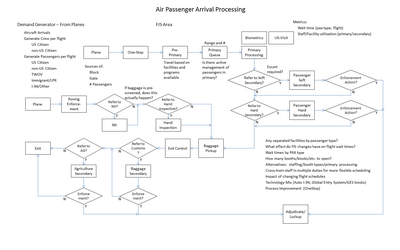
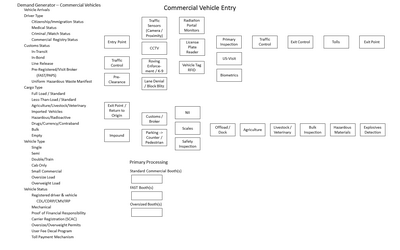
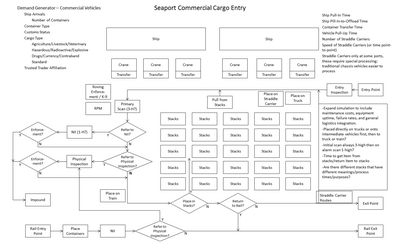
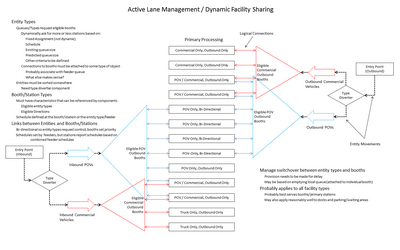
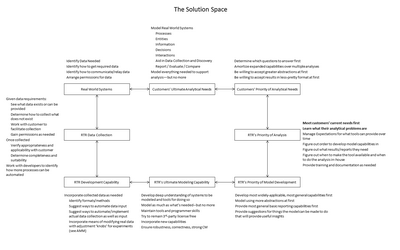
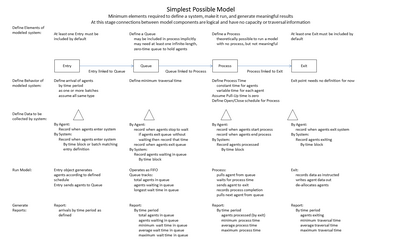
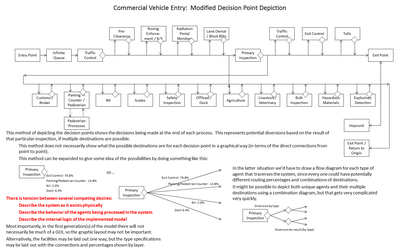
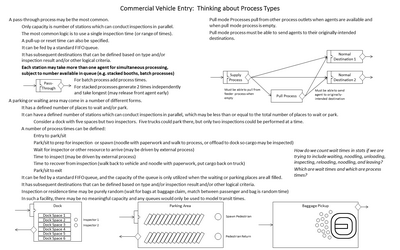
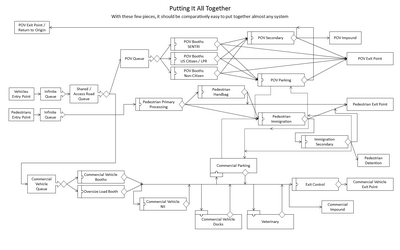
A picture is worth a thousand words. A diagram may be worth even more. These are just a few of the dozens I created during my analysis.
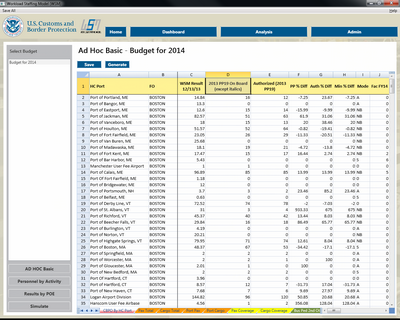
The most recent project I worked on was to analyze a spreadsheet model used to manage staffing requirements at all U.S. Ports of Entry (e.g., airports, seaports, land border crossings, ferries, bonded warehouses, and so on). The original tool, a large, multi-tabbed Excel spreadsheet, had been in use for some years and was effective enough, but the government analyst assigned to keep it updated, though diligent, motivated, and conscientious, was not a trained computer or data analyst. He did not know enough to employ rigorous data checking and so numerous errors were introduced, including the loss of some valid data. I identified these issues and included means of preventing their recurrence in the the replacement system we were building.
I teased apart the data sources and calculations in the spreadsheet and documented everything in detail. I was then able to define requirements for what the replacement system was supposed to do. It was really the simplest thing in the world to implement.
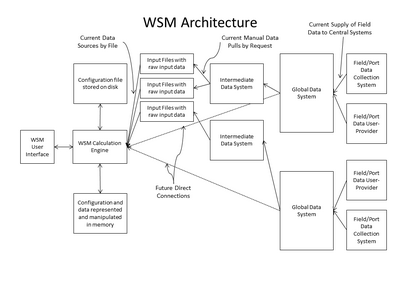
The data required by the AMM's yearly roll-up and simulation modules were inconsistent. It was clear that the provenance of all of the agency's data needed to be mapped and regularized. There is very little control over it and there is no one I'm aware of in the organization that has an appreciation for what this means, and the interest, clout, and attention span to marshal such an effort through to completion. RTR's senior managers had a junior employee start to work on this but I was not allowed to.
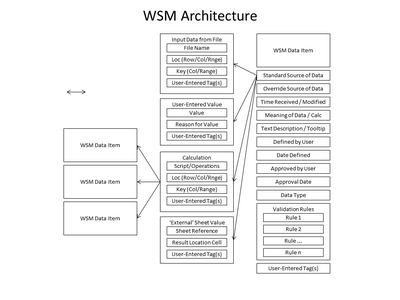
I defined a data layout that would unify all of the different data types, sources, time spans, and calculations. The layout also supported the UI I envisioned.
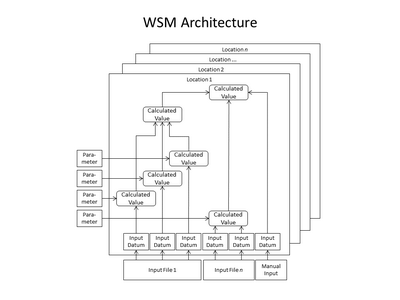
The yearly data roll-ups for each port, of which over 500 were included, were all built up from raw inputs and other factors like process time and number of inspectors required per operation. The diagram is only an abstraction; the full set of representations for each port included approximately 200 values.
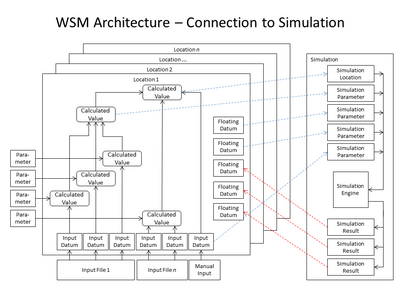
The base data structure would be expanded to directly incorporate the parameters needed to execute and run the simulation module. Means were defined to allow the user to specify parameters and ranges of ports that would allow multiple iterations configurations to be run and reported on automatically.
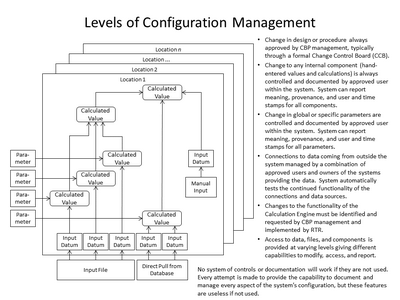
Plans for configuration management had to be considered for the model's code, the actual port configurations, the data inputs on which the models and calculations were based, the baseline representations, the different types of users, and the types of reports that would be generated and accessed.
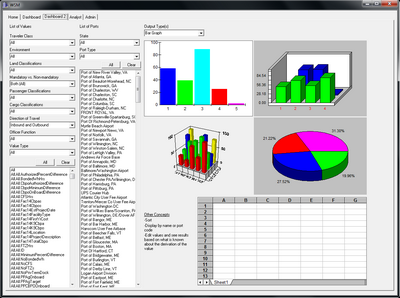
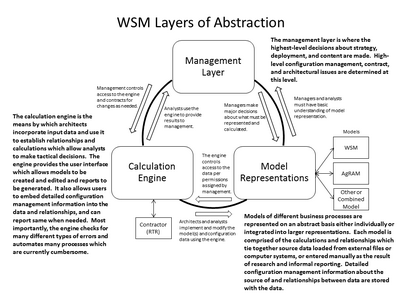
These were some concepts for what the tool should look like. What was actually built looked different than this.
RTR, like Bricmont, also went through two periods of reduced work hours. Most people worked four day weeks at commensurate pay and a handful were furloughed or released entirely. The first time this was announced at an all-hands meeting I shared that people should stick around because the company seemed like a good place to work. Over time, however, people started to drift away on their own as things deteriorated. If the company had not won a recent contract they would have shed a number of additional employees.
My own situation was complicated by the fact that the activities I was brought in to work on were largely not funded. The P-8 program went fallow for nearly three years as it worked through its own problems and delays, and weaknesses in the AMM model and the expectations and comprehension of the V-22 program led to the loss of its funding as well. I therefore spent most of my time helping out on this or that with no clear assignments or home. That's a long time to be in such a state at this point in my career.
Since leaving RTR I have learned the Java programming language and the Eclipse and IntelliJ IDEA programming IDEs. (I bought a personal subscription to the full, professional version of IntelliJ and I have maintained a full subscription to Safaribooks.com for several years now.). I have become certified by the Scrum Alliance as a ScrumMaster, Scrum Product Owner, and Scrum Developer (the latter course was given in Java using IntelliJ IDEA). I have completed several short classes on web development through Code Academy and Udemy. I have completed a book on Functional Programming (with exercises and examples in Java for additional practice). I've spent quite a lot of time learning web development, along with creating a website and blog. I learned the JavaScript language in great detail and a little bit of PHP. I have posted descriptions of my experience, discoveries, and development efforts consistently since October 2015, though my emphasis has shifted to process analysis and business analysis. To that end I also earned certification as a Certified Business Analysis Professional (CBAP).

