UI/UX Designer
In 38 years of writing, designing, and testing software in over a dozen different languages, I've designed, implemented, tested, and sought and received feedback on user interfaces for almost all of that time. I wrote graphics- and text-based UIs going all the way back to my time doing computer graphics and artificial intelligence projects at Carnegie Mellon University, and continued to learn new user interface schemas as they became popular. These included mouse-driven, text-based windowing systems (I even wrote my own framework that worked directly with video memory to support overlapping windows); fixed-sized, mixed-element GUIs; CAD- and freehand-based drawing apps; and now responsive, flexible interfaces implemented in JavaScript and HTML/CSS that work in desktop and mobile environments.
I know the UI elements and terminology inside and out and have designed and developed live systems in many frameworks as well as wireframes, mockups, and demos using a variety of tools including Visio, Balsamiq, and UI builders from different application frameworks.
User interfaces must provide:
- Control of program flow: Users need to know what they can do and when they can do it.
- Interaction with data elements: Values must be able to be input, output, and modified in ways that are consistent, efficient, and intuitive.
- Improved situational awareness: A good UI makes complicated and voluminous information easy to understand and manage.
- Context-appropriate modes of manipulation: Data should be manipulated and displayed in ways that make sense for the type of data, considering graphics vs. text, individual elements vs. groups or structures, packaging into messages or files or records, and reading from or writing to storage repositories including files and databases.
Here are some interface examples I've designed or implemented
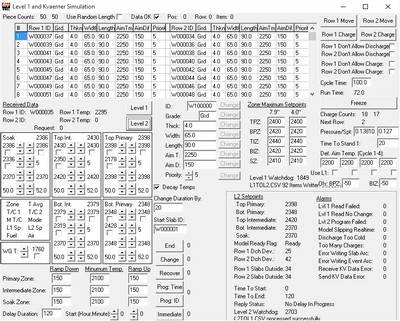
The image at the top shows the screen for a program used to test the interfaces to a Level 2 supervisory control system. It used several different communication methods in the background and required a large number of controls to exercise all the variables passed back and forth between the different communication processes. It stimulated (stimulated is the word we used for a kind of shorthand simulation) the behavior of certain aspects of the Level 1 system, which controlled the furnace in detail at a "lower" level (of abstraction). For example, it walked the zone temperatures toward their setpoints, but it didn't do this using a first principles physical and thermodynamic simulation, it just changed the relevant values in the appropriate direction. This was sufficient as the point was not to simulate reality but to ensure the system behaved using the correct logic. I did one of these for each of my PC-based control systems, and this one was knocked out in a single 14-hour day.
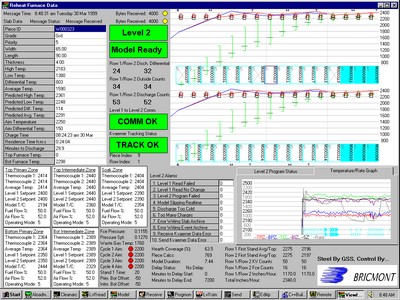
This is the main overview screen for a Level 2 supervisory control system. It shows the status of the furnace and the workpieces in the furnace, and also the communication and operating state of all support processes and interface channels.

This utility was written to allow users to review historical data recorded by one of the Level 2 systems I wrote. It could display information about furnace activity or the heating history of every billet, beam blank, round, or slab that was processed. The screen at the top of the page is the main display for a Level 2 system, and it shows the status of the furnace and the location and state of every workpiece in the furnace. It gave a very powerful and complete overview of the situation in real time.
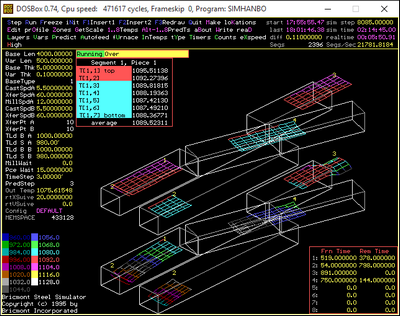
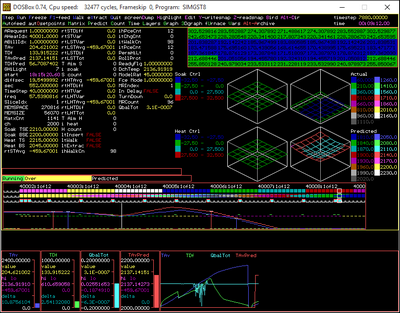
These two simulation test beds were based on an original version I developed at Westinghouse. The top one shows a two-line swiveling tunnel furnace and the bottom one shows a walking beam furnace. Information was displayed about the state of the simulated system and the state of the simulation itself. The key commands and toggle state were shown in the upper rows, and the listed values toward the upper left could all be edited while the simulation was running. The nature and geometries of the two types of furnaces required two very different graphic displays.
This early work at Bricmont got me noticed in a good way. My desk was a frequent stop for guests being shown around the office, one group of which ended up buying the company from the founder, and I was often asked to give demos.
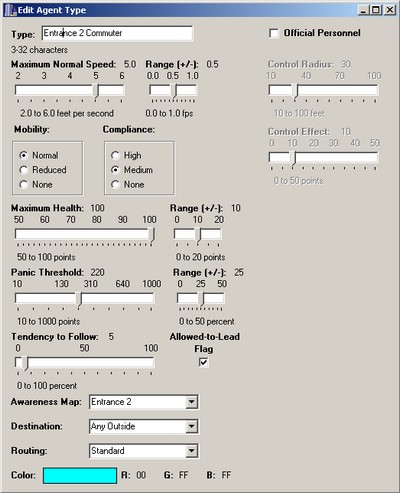
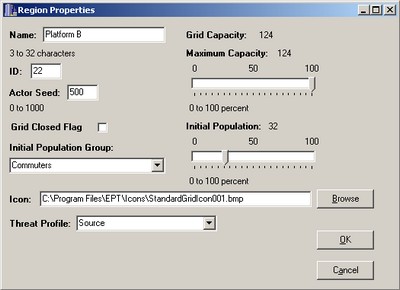
These two screens were mockups I made describing the design for an evacuation planning system we built at Regal Decision Systems. Each aspect of simulation was configured by a different screen and the controls showed what variables were required to configure and model the system.
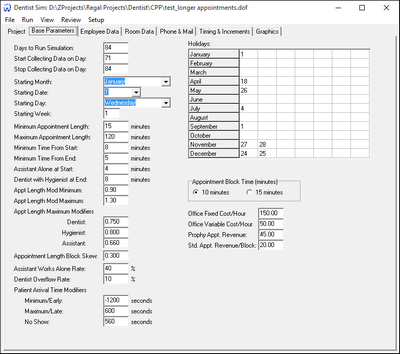
This was one of the screens used to configure models of different medical and dental offices. The tabs each displayed a separate collection of controls and displays, and all were as busy as this one.
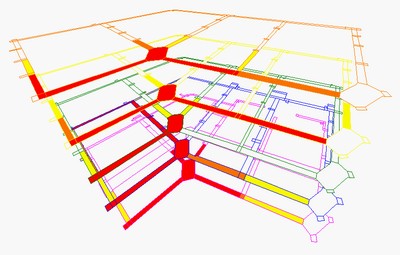
This display showed the location and intensity of a particular kind of threat as it evolved over time within a building. The evacuation guidance system was designed to route building occupants to safety with the least amount of exposure. The animation could be rotated around two axes and I wrote the 3D display and rotation functions from scratch. The near-real-time threat data was received by the system in a file that was over a gigabyte in size.
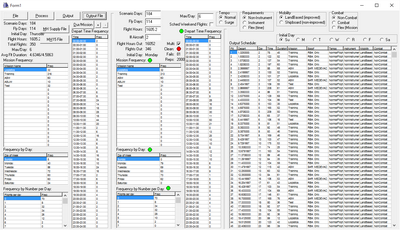
This display allowed me to generate randomized flight schedules for groups of aircraft based on historical usage patterns for different scenarios. It would output generated results in files formatted to be read directly by the Aircraft Maintenance Model we maintained and ran at RTR Technologies.
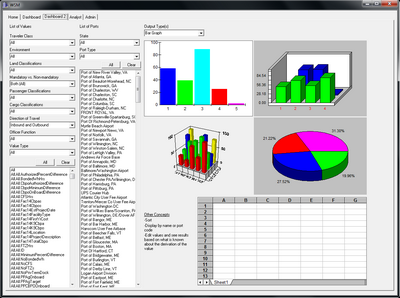
This was a proposed UI for a staffing model we rewrote for a major government agency managing tens of thousands of employees. My conception of what the working UI should be changed over time, but this idea for a management dashboard didn't change as much. I've since taken up Tableau for the display of much of this kind of information.
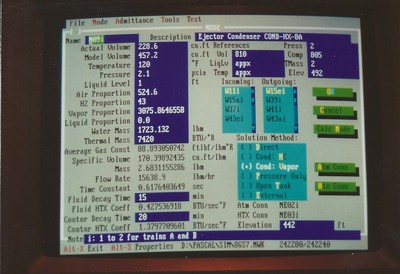
This screen was written using the Turbo Vision framework that came with Borland Pascal version 6 in 1991. It was an object-oriented GUI framework for text-based DOS systems in the standard metaphor we still use today. It was part of a system I wrote to calculate constants for thermo-hydraulic models for full scope nuclear power plant training simulators. This particular screen showed all of the data associated with the nodes (volumes) of the fluid models. Some of the values were editable and some were derived, often using steam table lookups that also used functions I wrote. The screen also allowed entry of document numbers (from a library of over 10,000) showing where the relevant data items were found. The program generated all of the required documentation for the models.
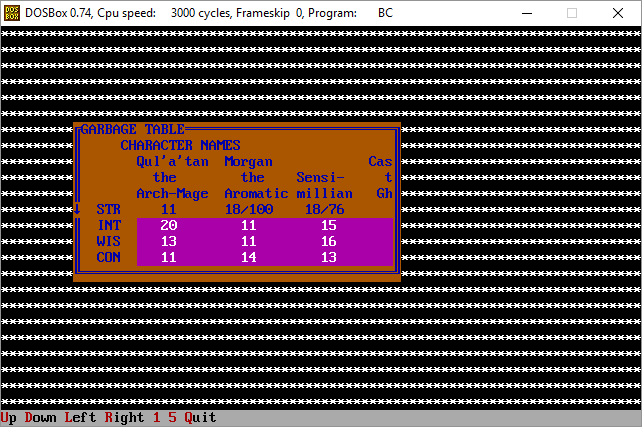
I kept busy with exercises like this while I was in the Army. I wrote my own text-based windowing system that saved and restored screen memory directly and incorporated mouse inputs. It wasn't for anything serious (as you can tell!), but it kept me working and thinking and learning.

